Leadership in academic settings

Quantitative study

The quantitative part of our project included an online survey to investigate which of these different leadership roles was most strongly associated with diverse outcomes within the university. The survey was distributed to all employees through email, resulting in a diverse sample of 918 participants. The demographics of participants were analysed, revealing a balanced distribution across age groups, a majority of female participants (66.2%), and a relatively balanced representation across different groups within the university. Participants were randomly allocated to complete either the formal or peer leadership role questions. At the end of the survey, they were given the option to complete the other section as well. In total, 680 participants completed the formal leadership roles questions, while 635 completed the peer leadership role questions.

Research design

The aim of this study was to investigate different leadership roles within the univeristy, and to see if these leadership roles relate to team functioning. For the purpose of this study, an online survey was designed and implemented using the Qualtrics platform. The survey served as the primary means of data collection, allowing participants to provide responses to questions and measures aimed at collecting information on how they perceive different leadership behaviours and roles within their own team, and varying team outcomes. The specific leadership roles and behaviours used in the survey can be found here.

To ensure a comprehensive sample, the link to participate in the study was distributed through email to all of its employees and the survey could be accessed both in Dutch and in English. This approach facilitated access to a diverse range of participants with varying backgrounds and roles within the organization. The utilization of an online survey and the involvement of KU Leuven in distributing the survey link played a crucial role in obtaining a substantial and representative dataset for further analysis. Important to note is that people could only fill out the survey as a team member, and not as a formal leader, in order to recruit an adequate sample in board teams as well.

To reduce the length of the online survey, participants were randomly referred to a survey including the leadership behaviours and roles for either the formal leader or the team members (here referred to as peer leaders). After having completed the questions on team outcomes, every participant had the choice to also complete the questions relating to the leadership roles they had not yet completed, but this was an optional choice.


The data collection period spanned from January 20, 2023, to March 2, 2023, encompassing approximately six weeks. During this timeframe, participants were encouraged to complete the survey at their convenience, allowing for flexibility in participation. During this period, a total of 1,930 participants (i.e., unique ‘clicks’ to the survey) were recorded by the Qualtrics platform.

In order to ensure the integrity and quality of the collected dataset, data cleaning procedures were applied. Several individuals were excluded from the analysis due to various reasons. Firstly, 56 participants were removed as they did not provide consent to use their data for research purposes. Additionally, 872 individuals were excluded from further analysis as they had only filled out demographic information, without providing any data regarding leadership or outcomes. Moreover, 28 participants were eliminated from the dataset as they failed to correctly complete the attention checks, which were implemented to ensure data reliability. Furthermore, 10 individuals were excluded based on their own remarks, indicating a misunderstanding or misinterpretation of the instructions provided. In addition, 7 participants were removed due to unrealistic completion times under 10 minutes, suggesting inadequate engagement with the survey. Furthermore, 39 individuals who initially identified themselves as formal leaders chose to discontinue their participation after being given the option to select a team they would be a part of, rather than continuing as the formal leader (as only team members, rather than formal leaders were included). Finally, to maintain the anonymity of the participants, personal information and comments were removed from the dataset. Following the data cleaning process, the final total of participants included in the analysis amounted to 918 individuals.

All data collected was securely stored on password-protected university computers, accessible only to the research team. Personal data collected for research purposes, such as gender and age, were pseudonymized during data collection. Additionally, participants had the option to provide contact information for study updates, which was kept separate from the research data and not included in the analyses.

    Participants

    As stated above, there were a total of 918 valid participants. This section will discuss various demographics relating to the participants (i.e., gender, age, which group within KU Leuven these participants are part of, and whether they completed the questions relating to the formal leadership roles, the questions relating to the peer leadership roles, or both.

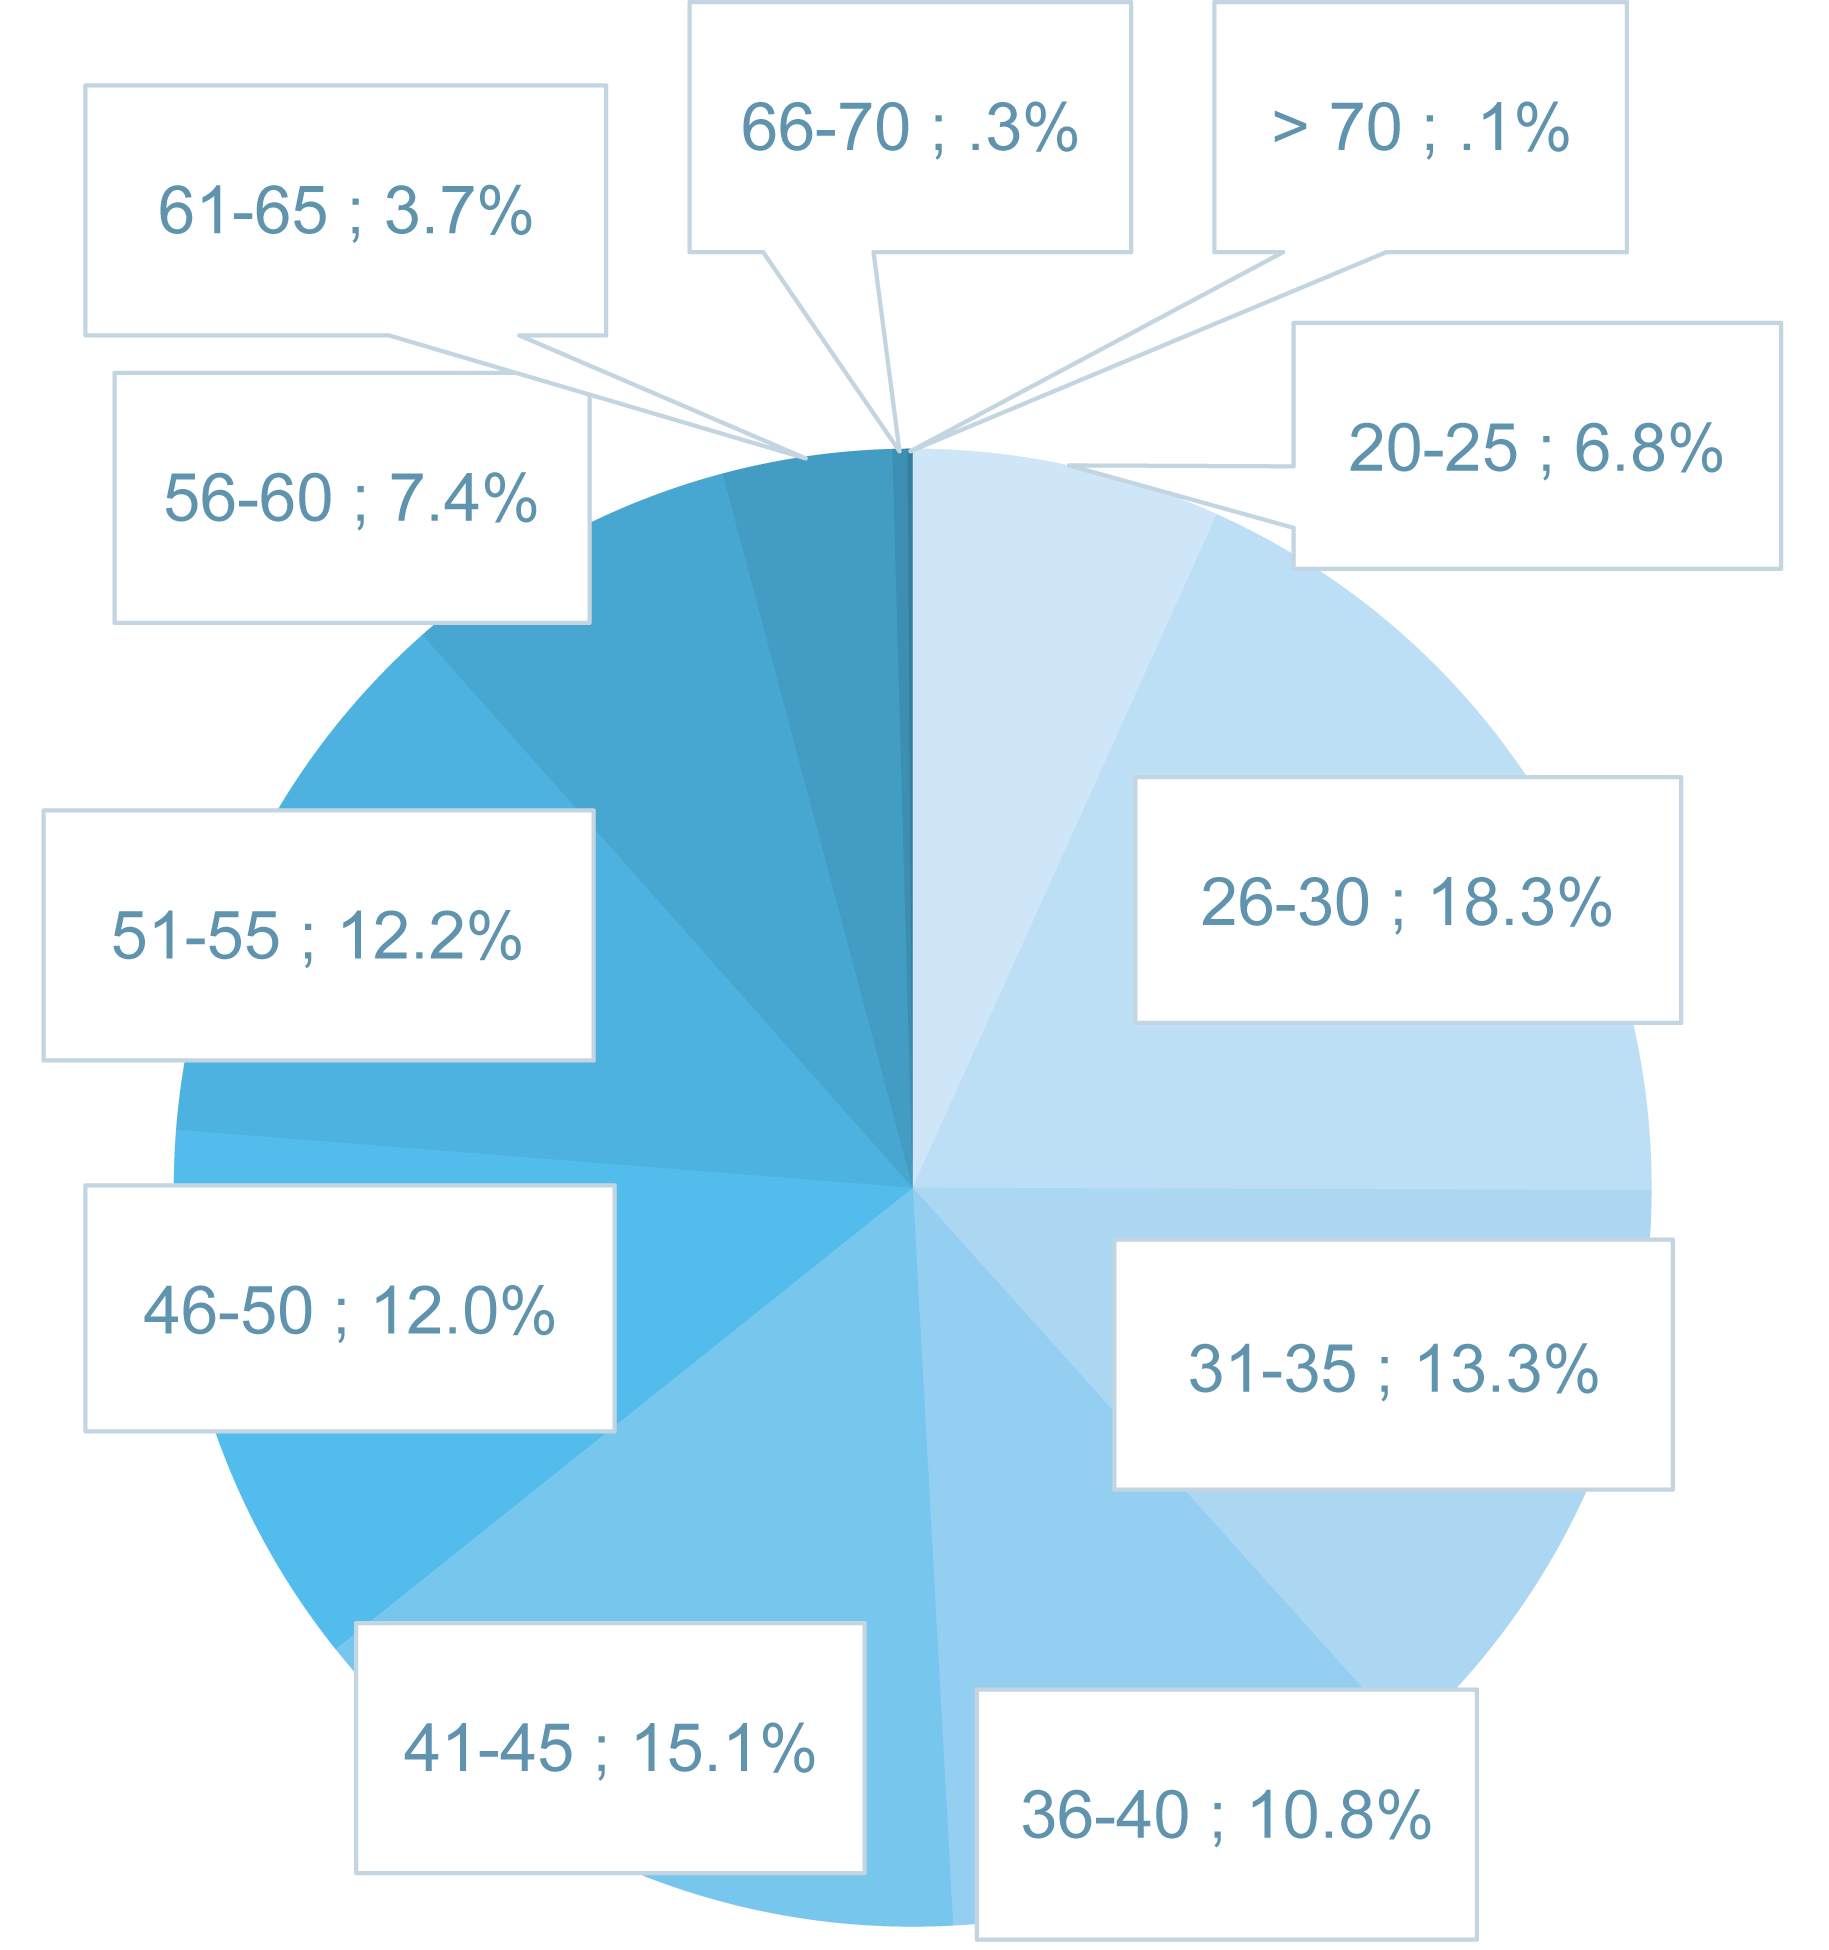
    The following pie chart presents the distribution of our participants across different age groups. Approximately half of our participants belong to the age range of 20 to 40 years, while the remaining half falls within the age range of 41 to 70+ years.


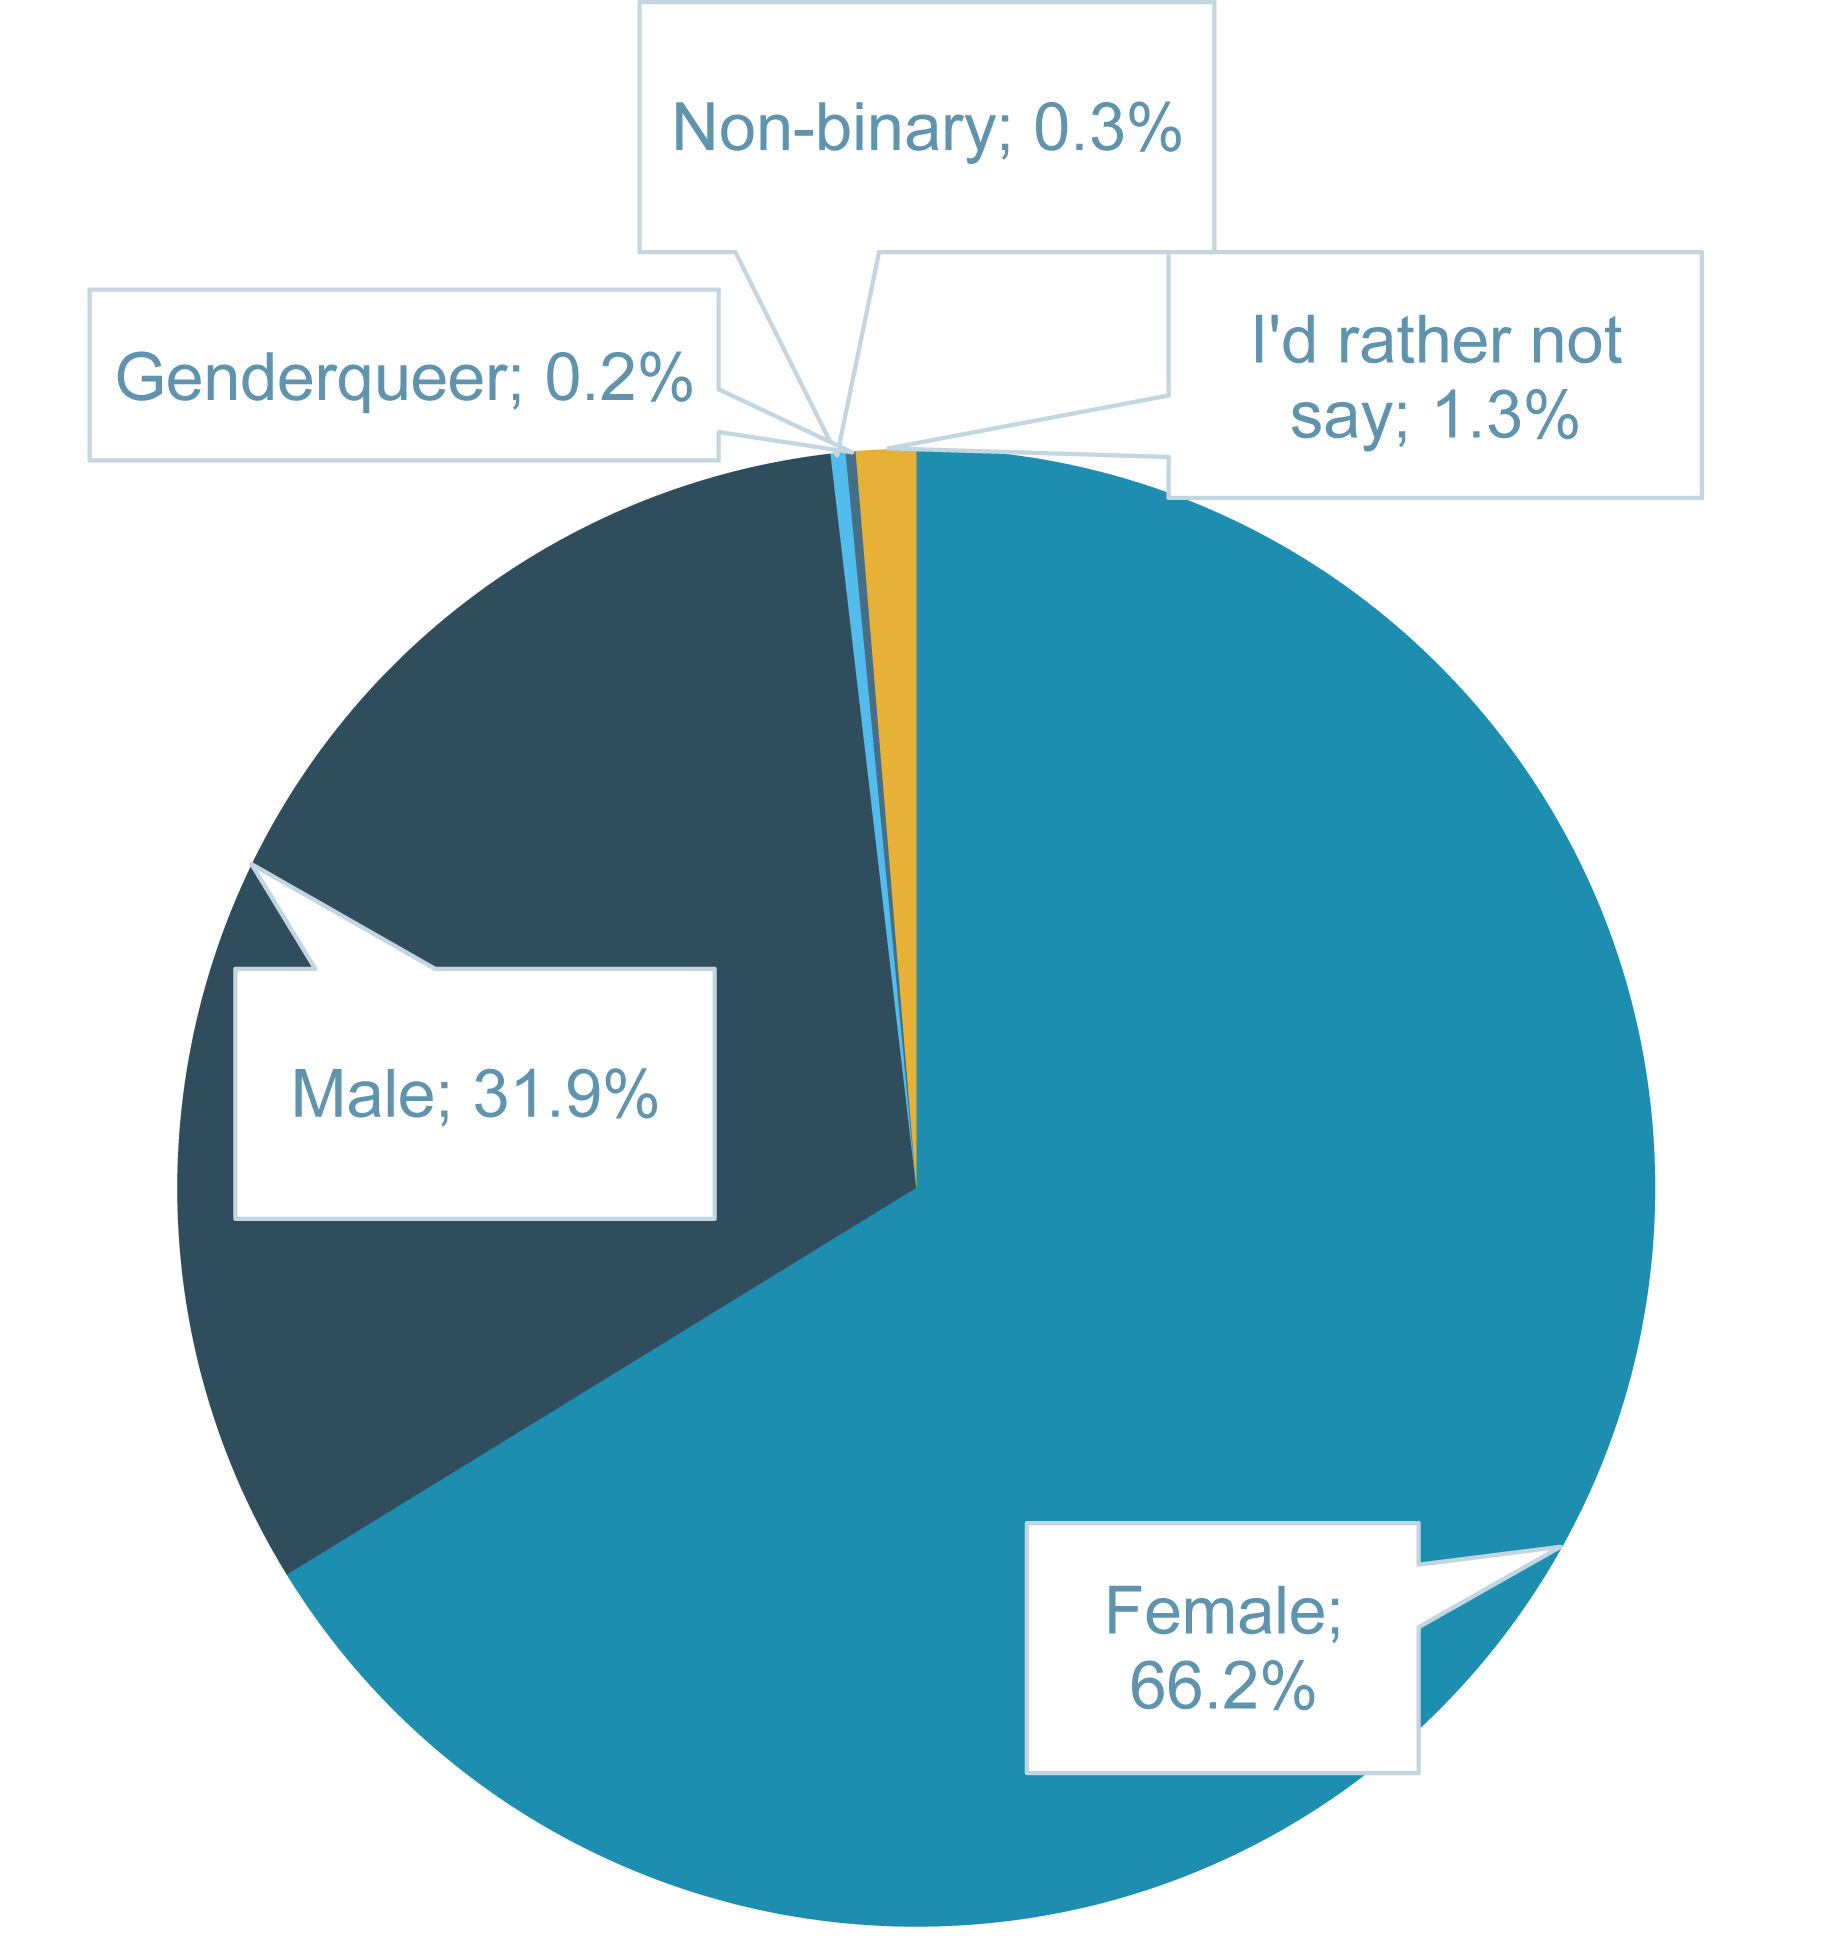
    The next pie chart illustrates the gender distribution within our participant sample. The majority of participants identified as female (66.2%), followed by male participants (31.9%). A smaller percentage of participants identified as non-binary (0.3%) or genderqueer (0.2%). Additionally, a small proportion of participants chose not to specify their gender (1.3%).

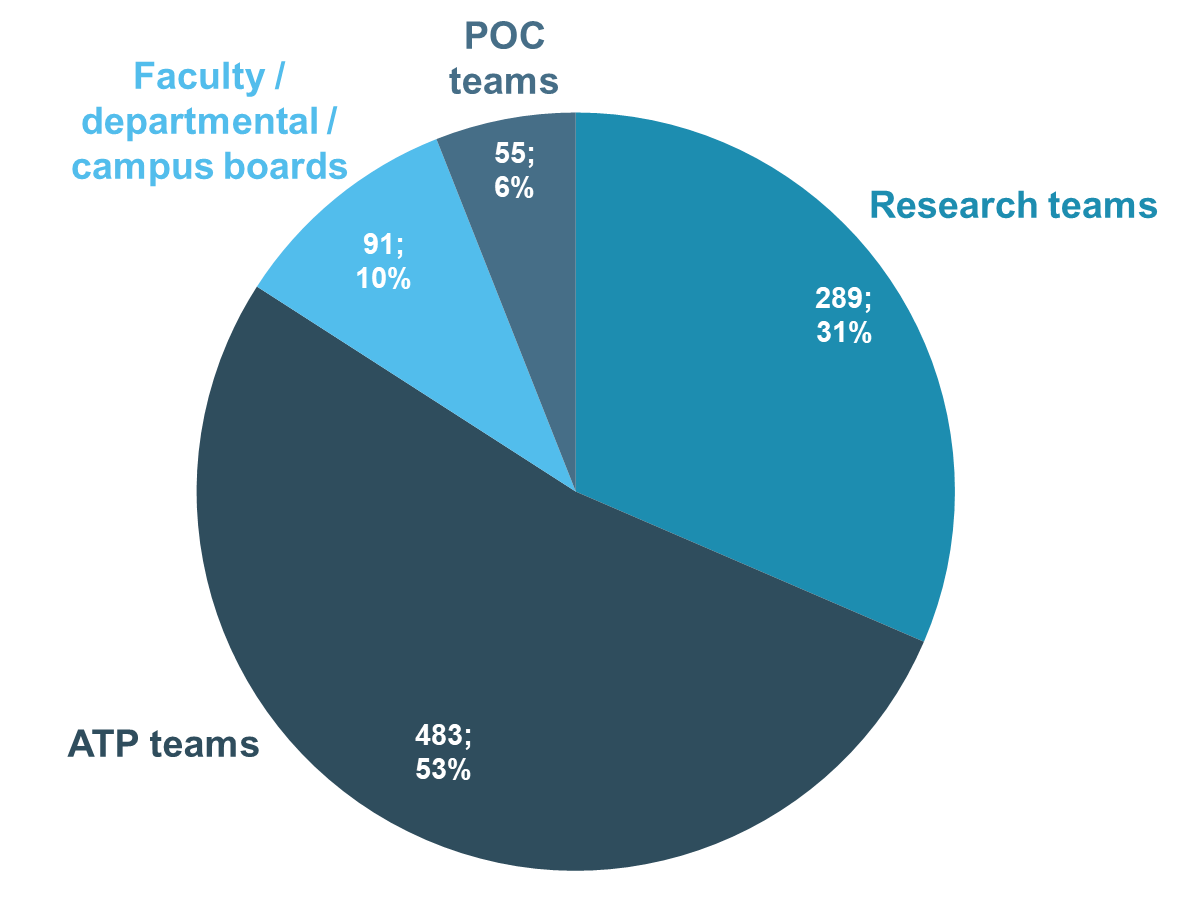
    The following pie chart provides a visual representation of the distribution of our participants across the various groups at the university. Notably, the distribution appears to be relatively balanced across these groups. Furthermore, the chart also displays the ratio of male and female participants within each group.

    This pie chart illustrates the relative proportions of participants who exclusively completed either the questions pertaining to formal leadership roles, the questions concerning peer leadership roles, or those who opted to complete both sets of questions.


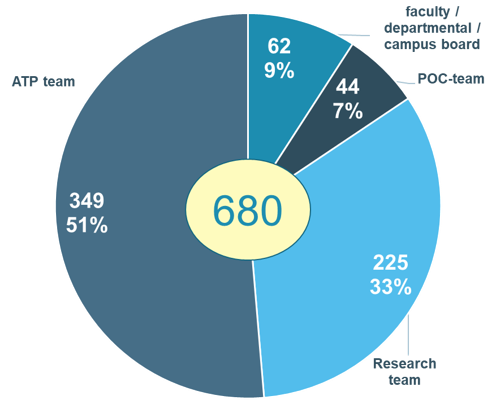
    This next pie chart displays the subset of our sample that completed the questions related to formal leadership roles. This includes participants who exclusively completed these questions, as well as those who completed both sets of leadership questions. In total, this subset includes 680 participants. The chart further illustrates the distribution of the participants across the different types of teams they were part of.

    This final pie chart depicts the segment of our sample that completed the questions pertaining to peer leadership roles. This encompasses participants who exclusively answered these questions, as well as those who responded to both sets of leadership inquiries, resulting in a total of 635 participants. The pie chart also demonstrates the distribution of these participants across various types of teams they were involved in.