Descriptive data formal leadership roles
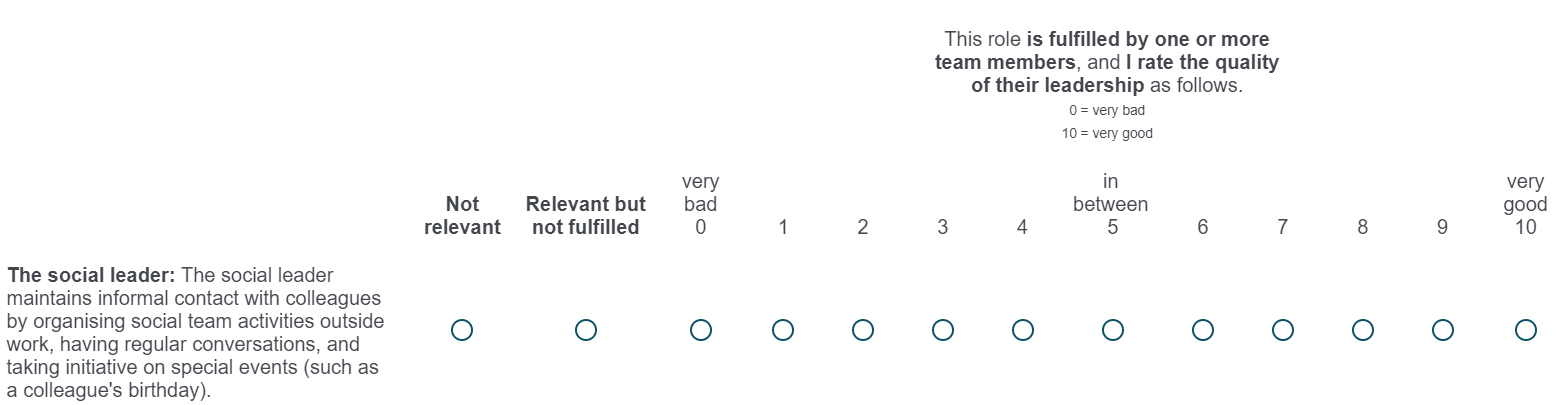
When participants were answering questions relating to leadership behaviours and roles, they had to carefully consider their response. For each leadership behaviour and leadership role, participants had three options:
- This behaviour/role is not relevant in the context of my team.
- This behaviour/role is relevant, but is not shown by the formal leader.
- The formal leader fulfills this behaviour/role, and I rate the quality of his/her leadership on a scale of 0 (very bad) to (very good).
An example of how this appeared on the Qualtrics platform is provided in the image below:
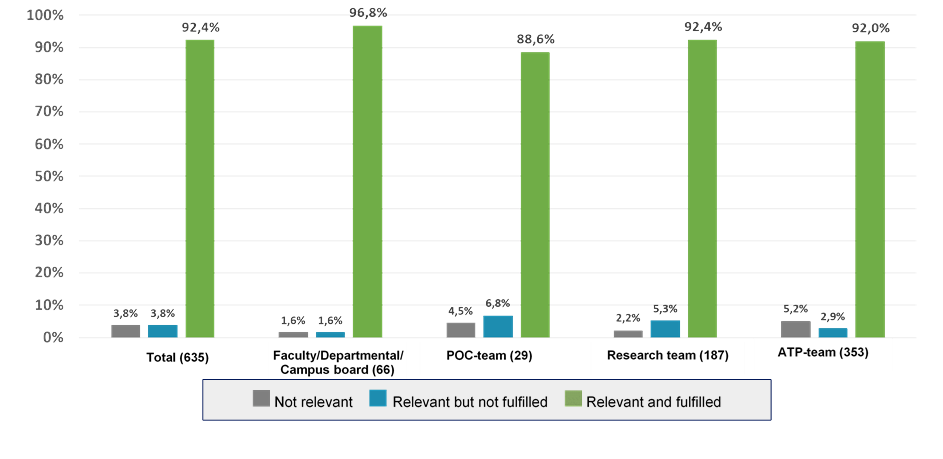
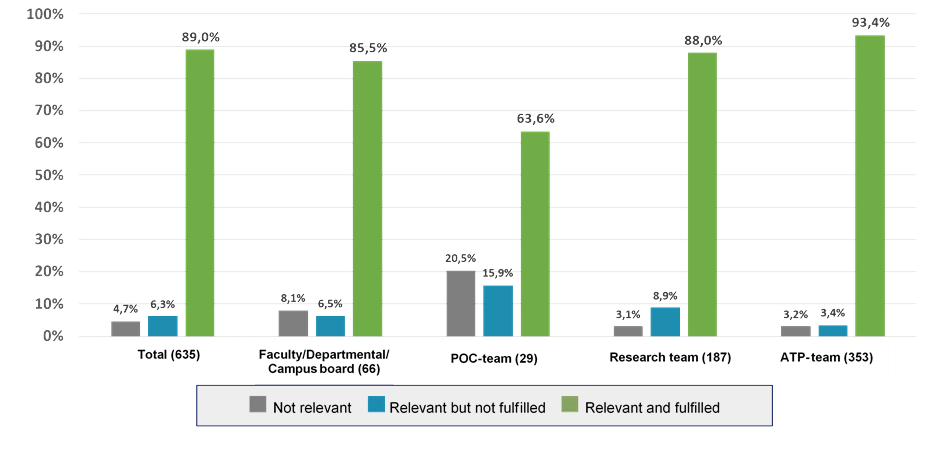
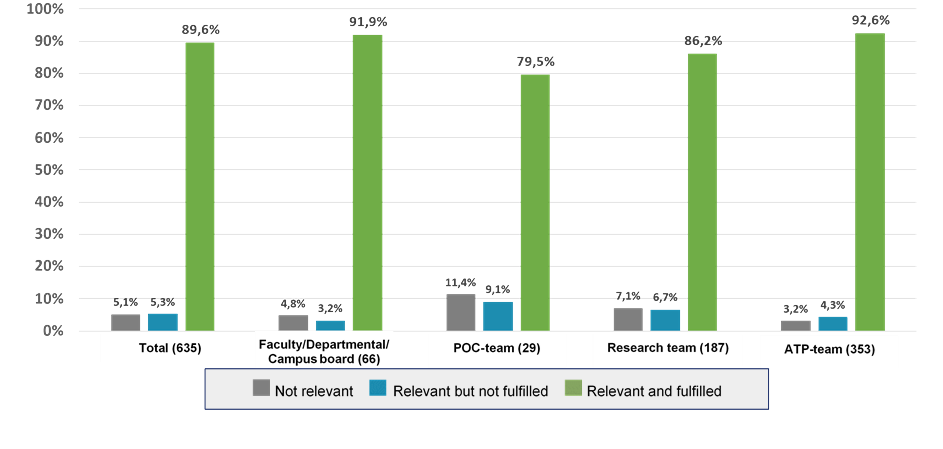
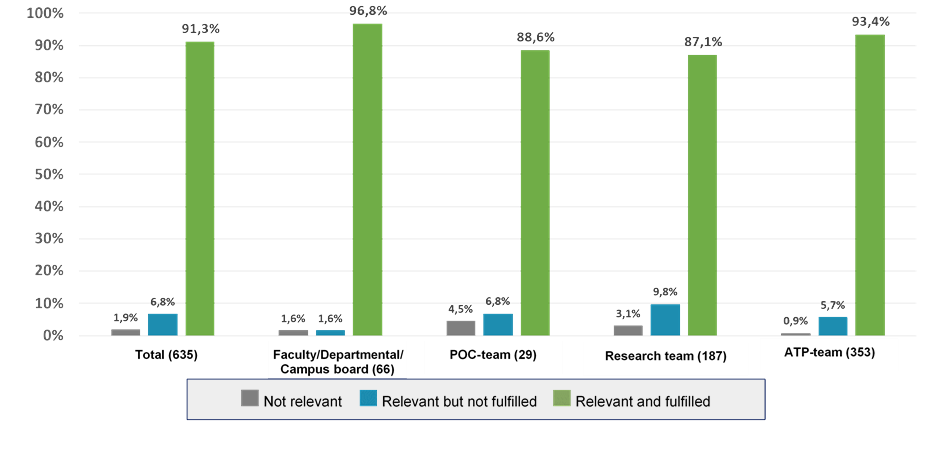
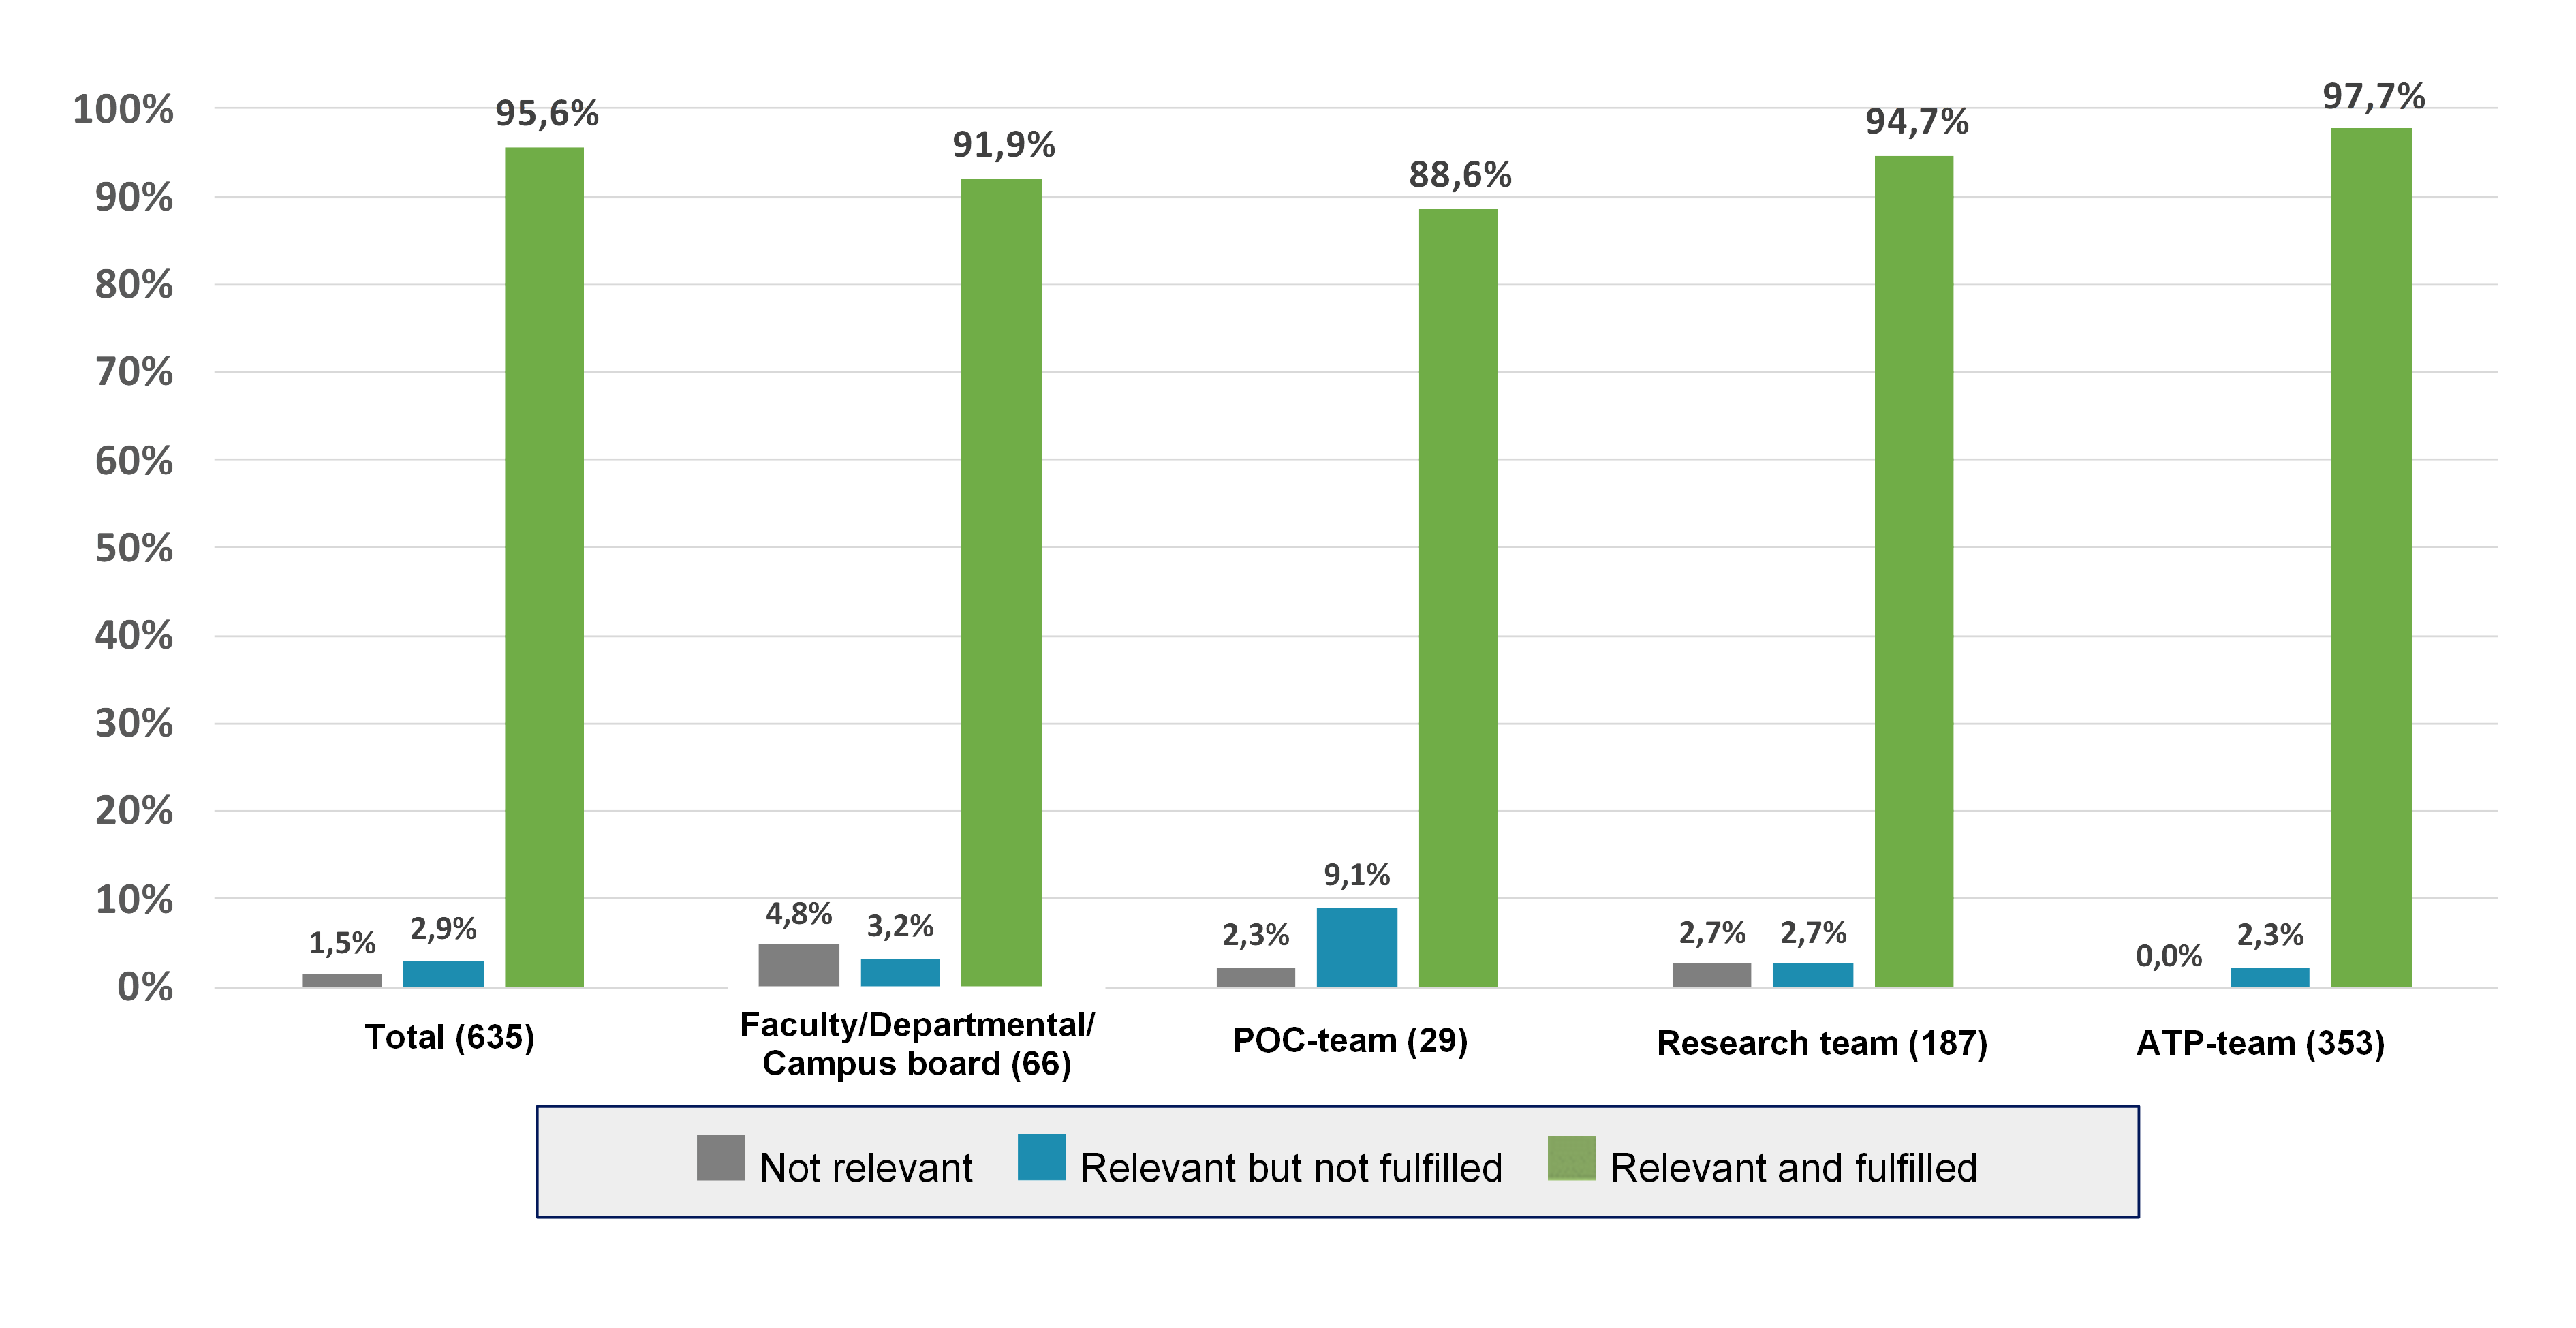
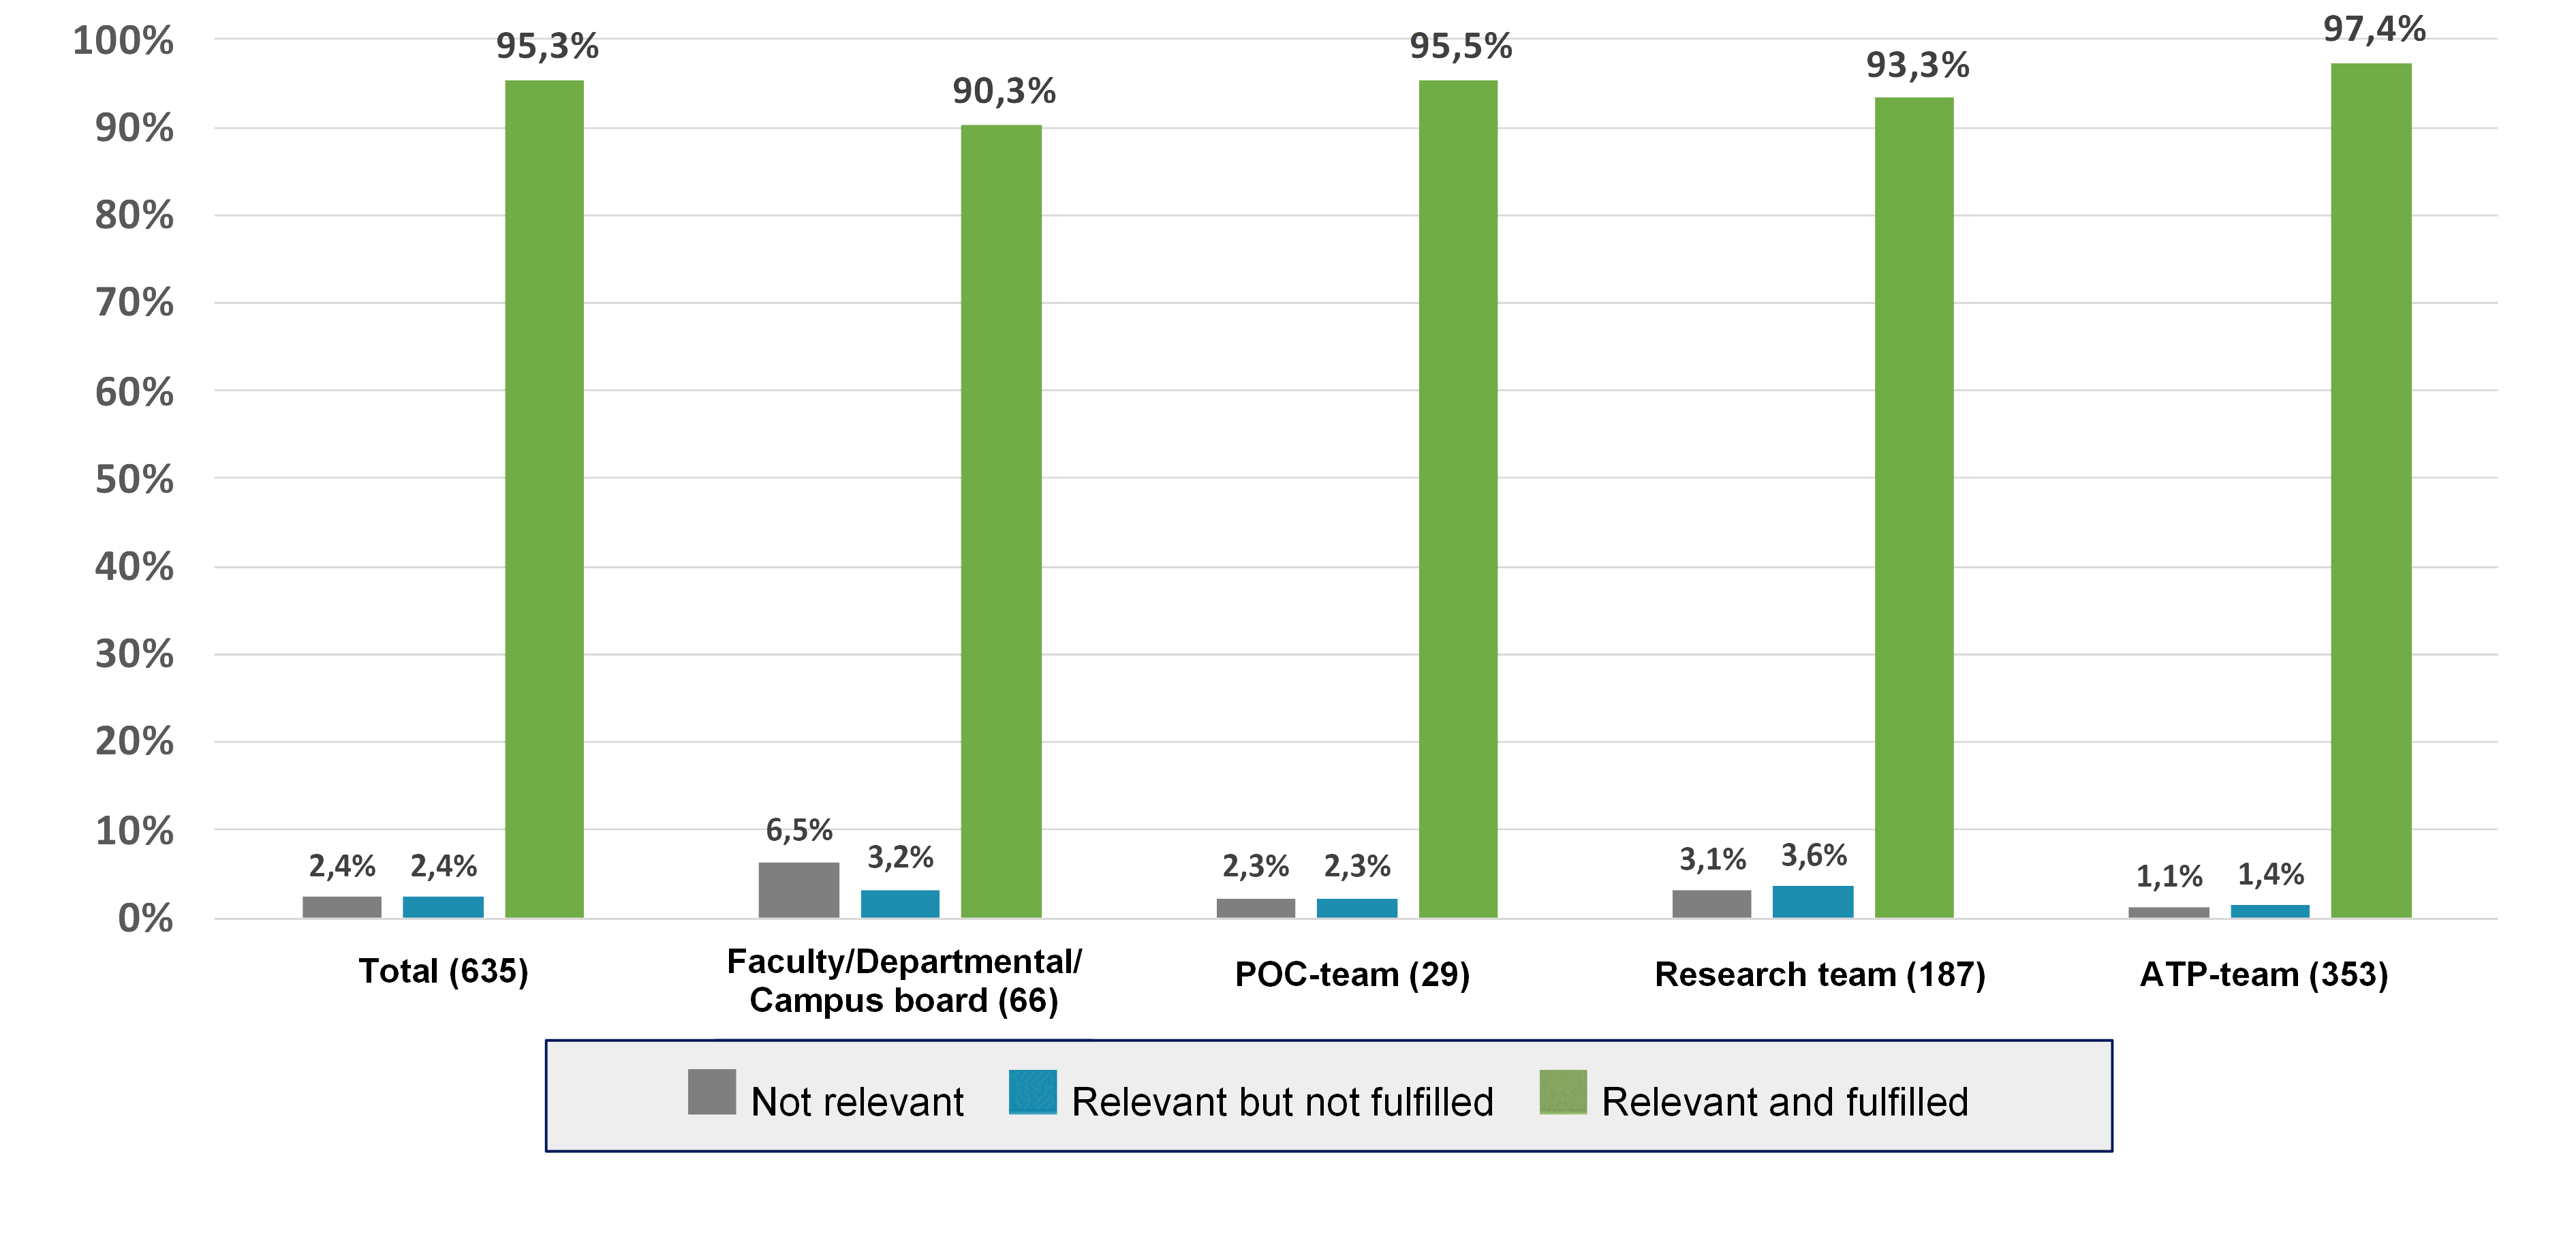
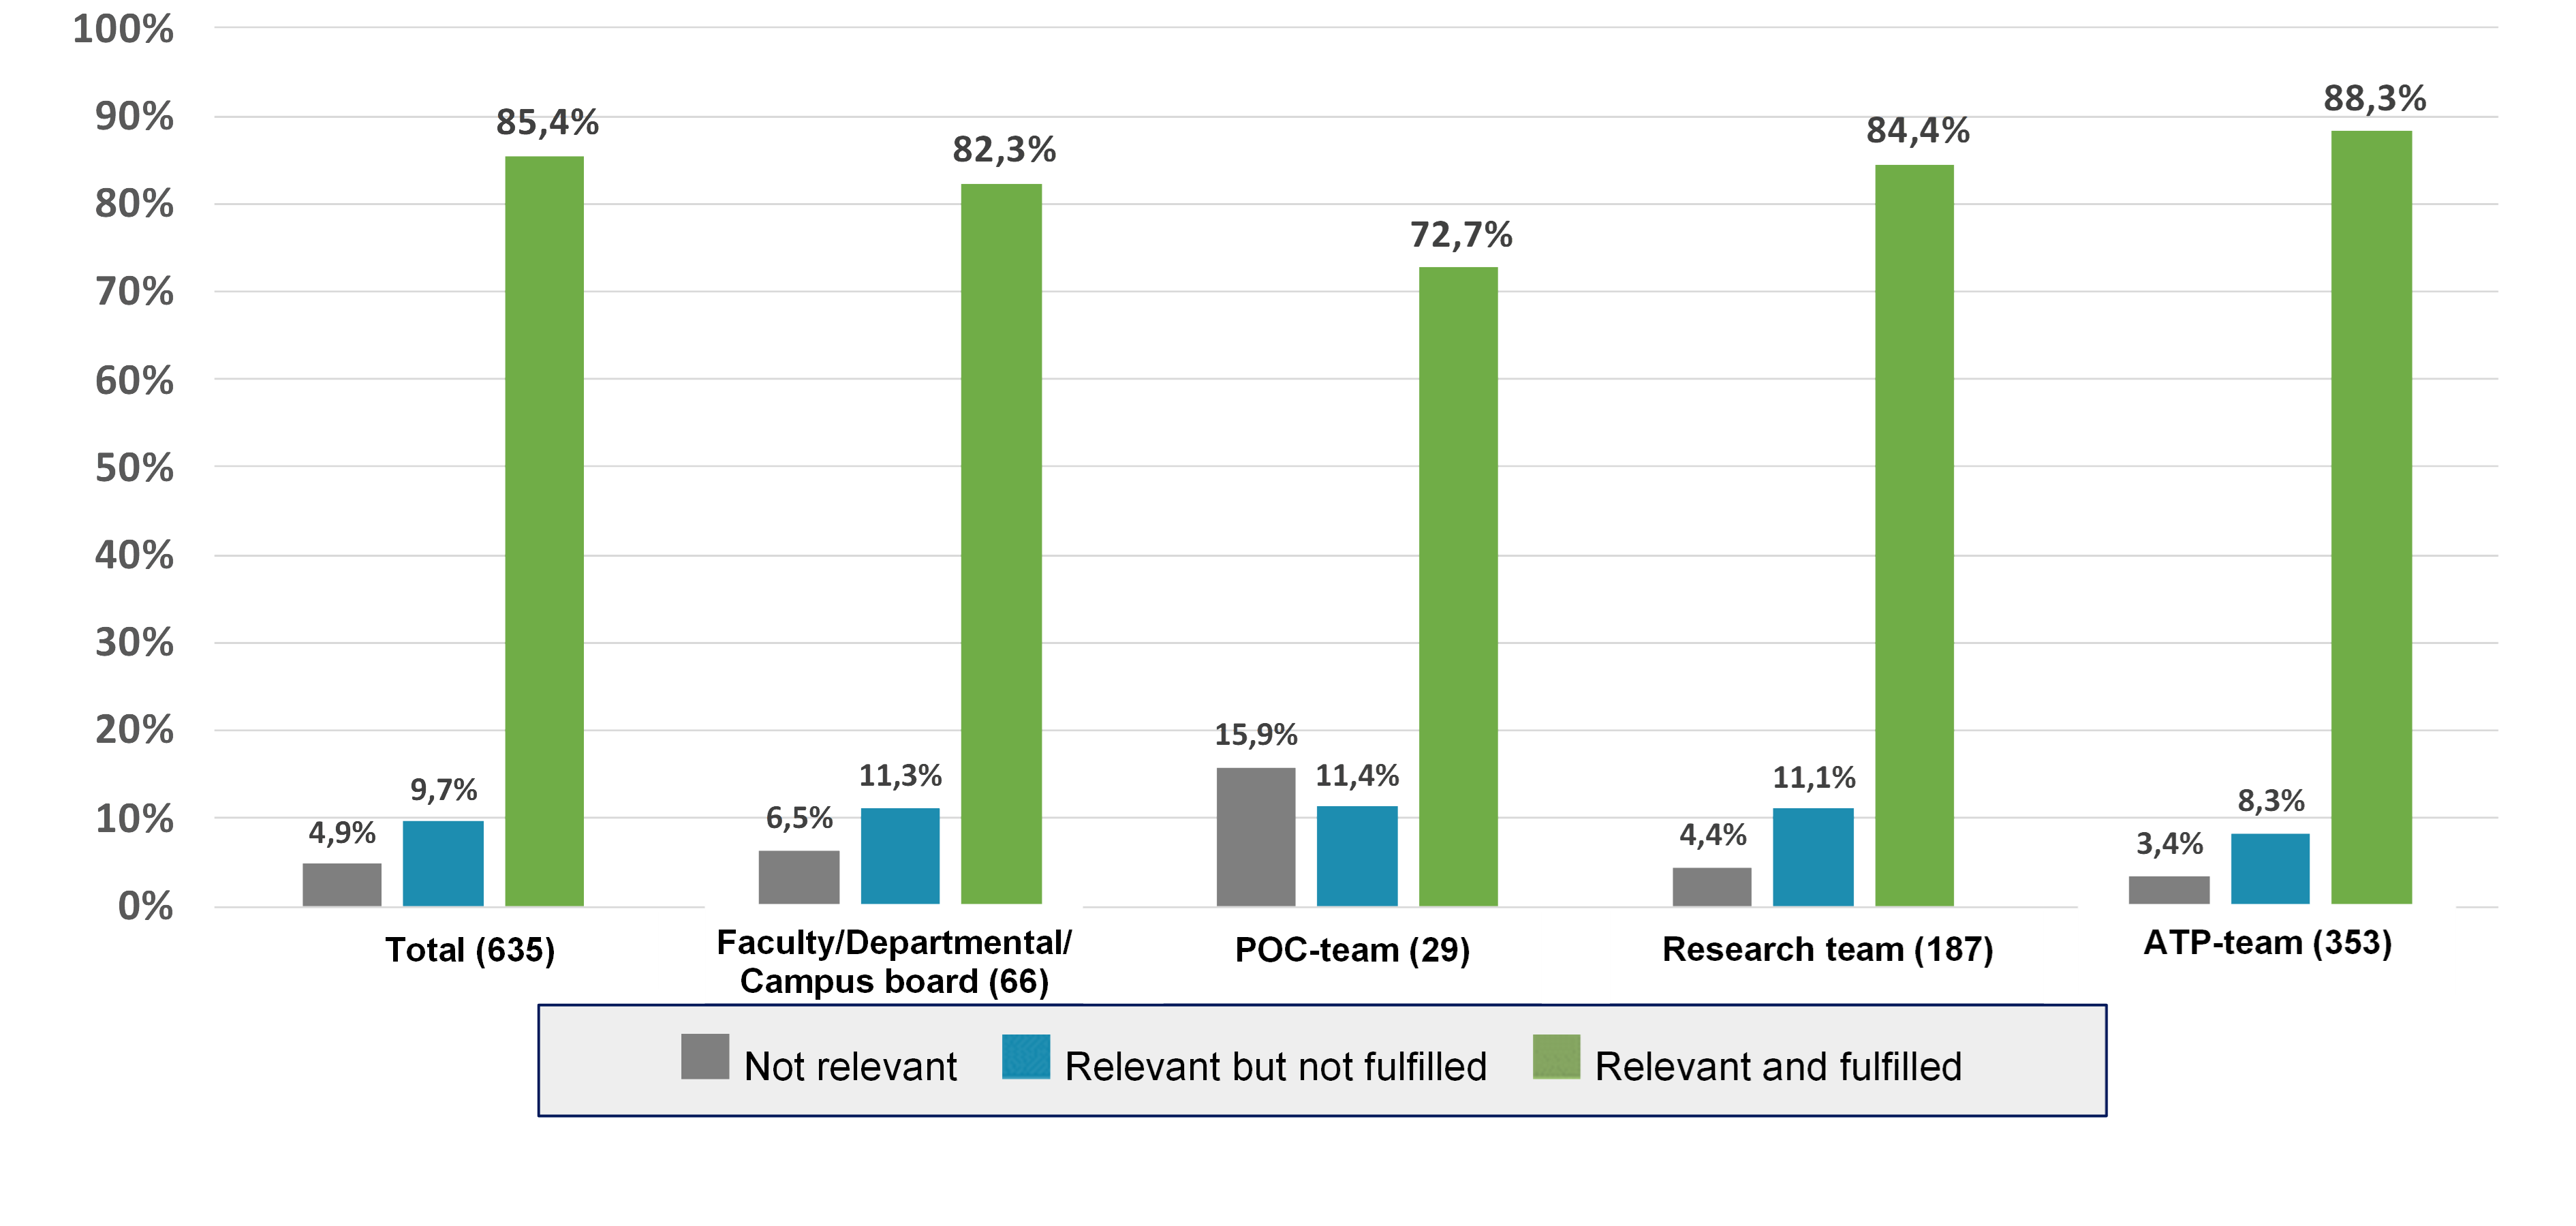
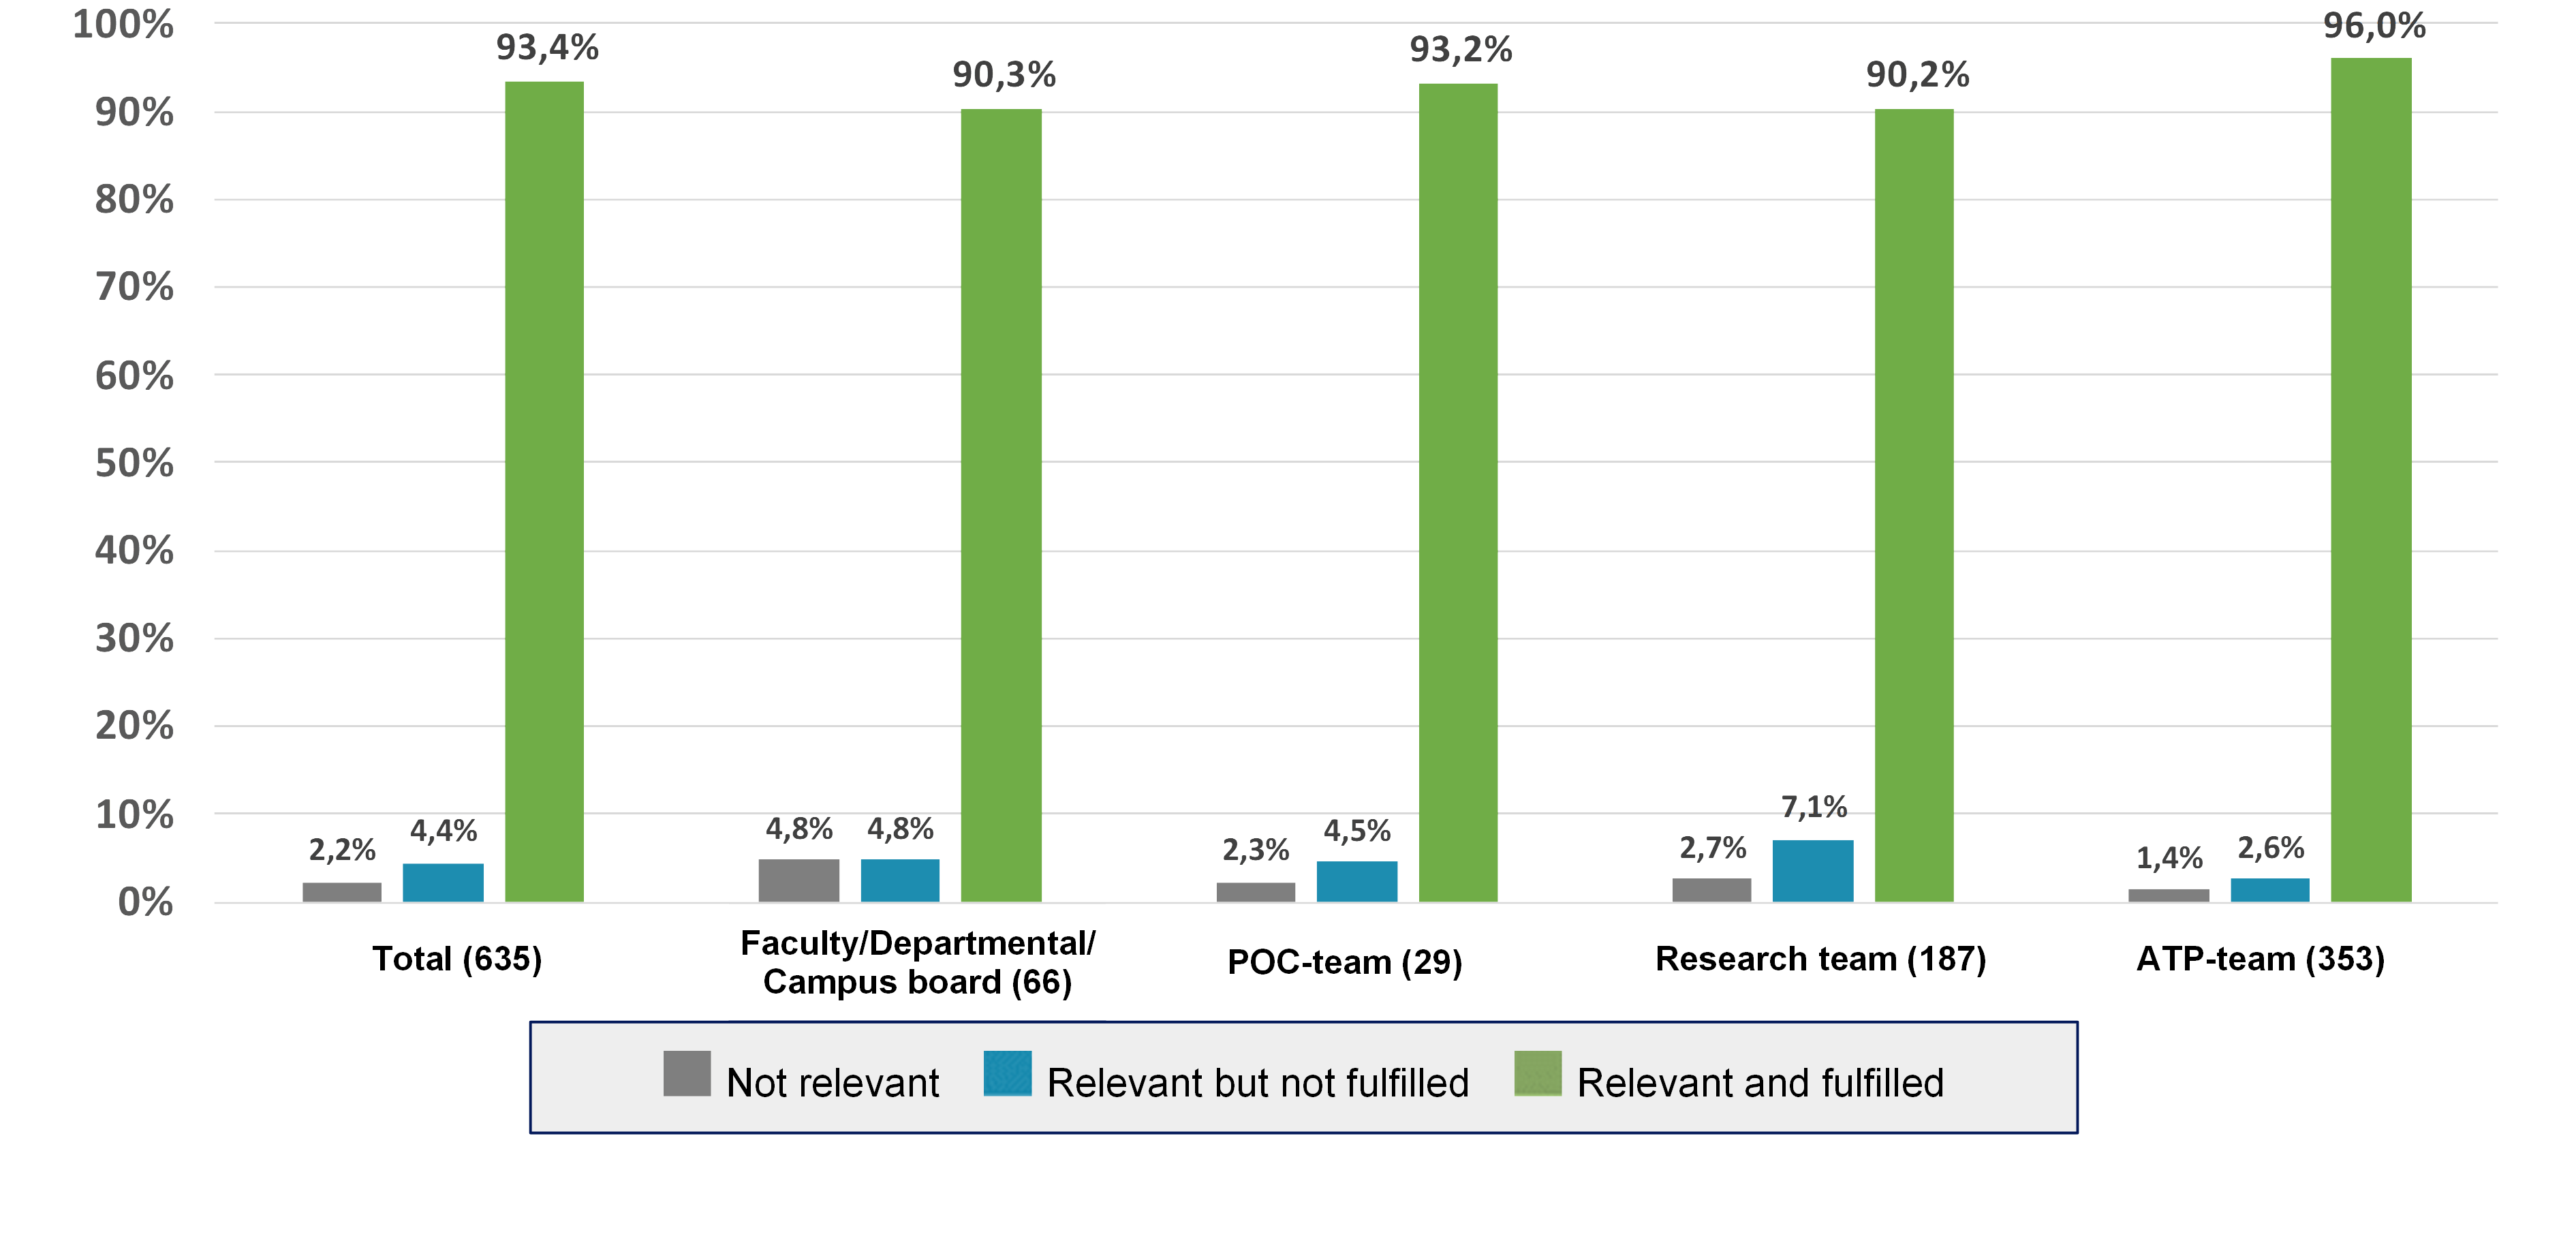
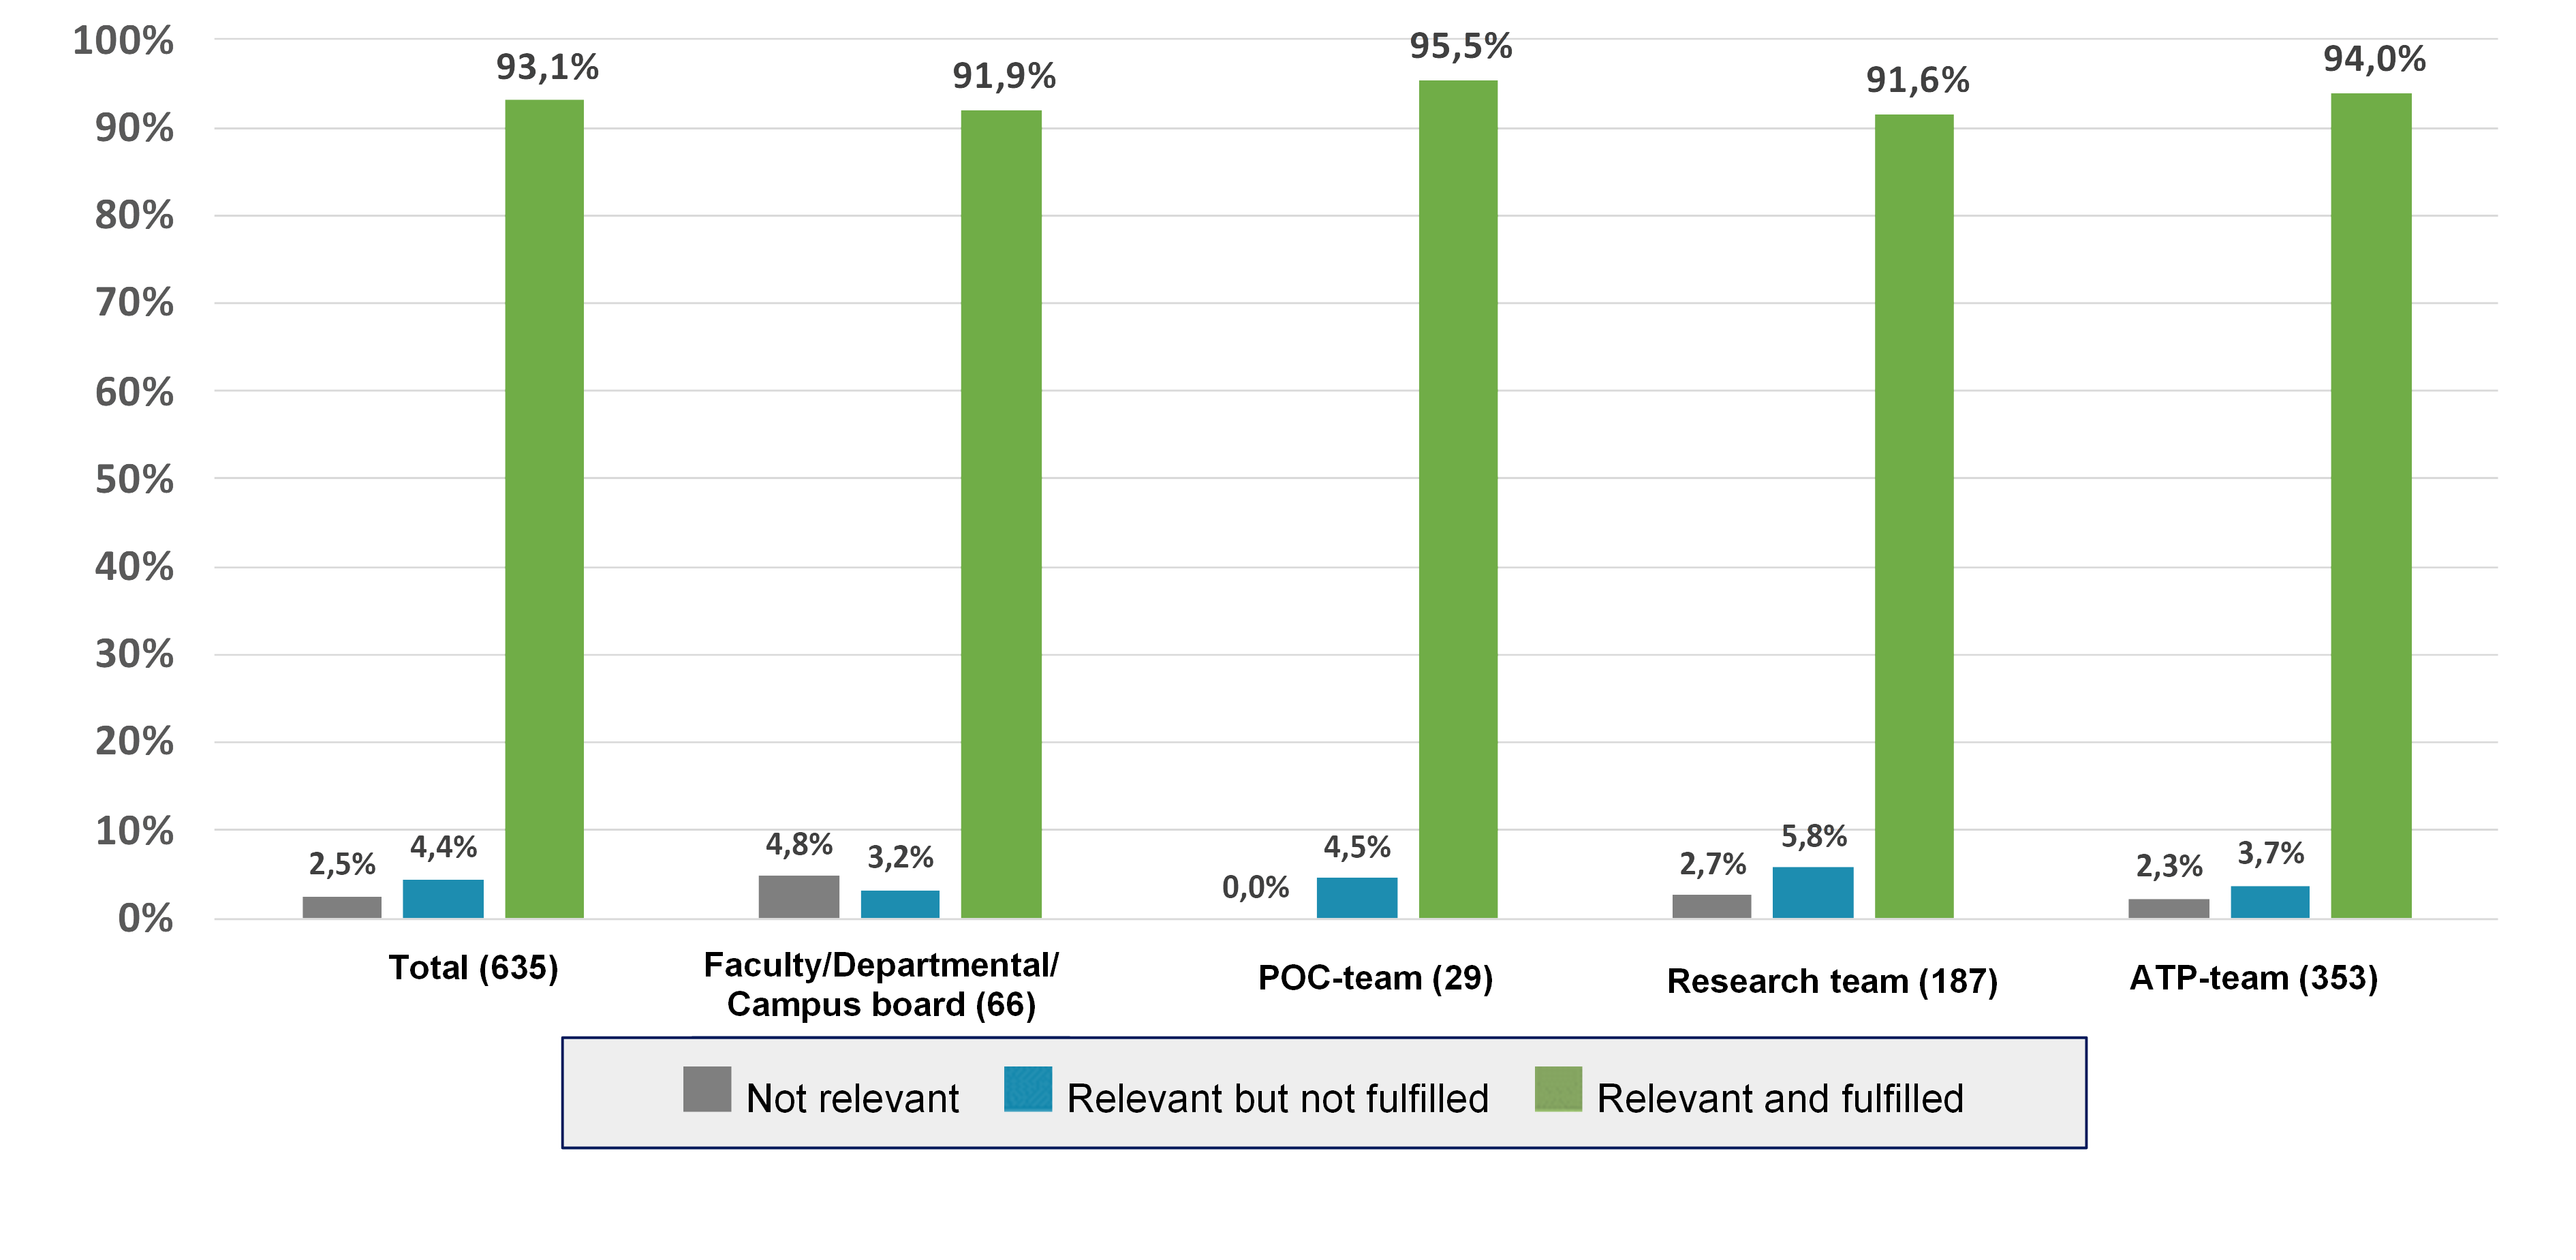
Relevance of formal leadership roles
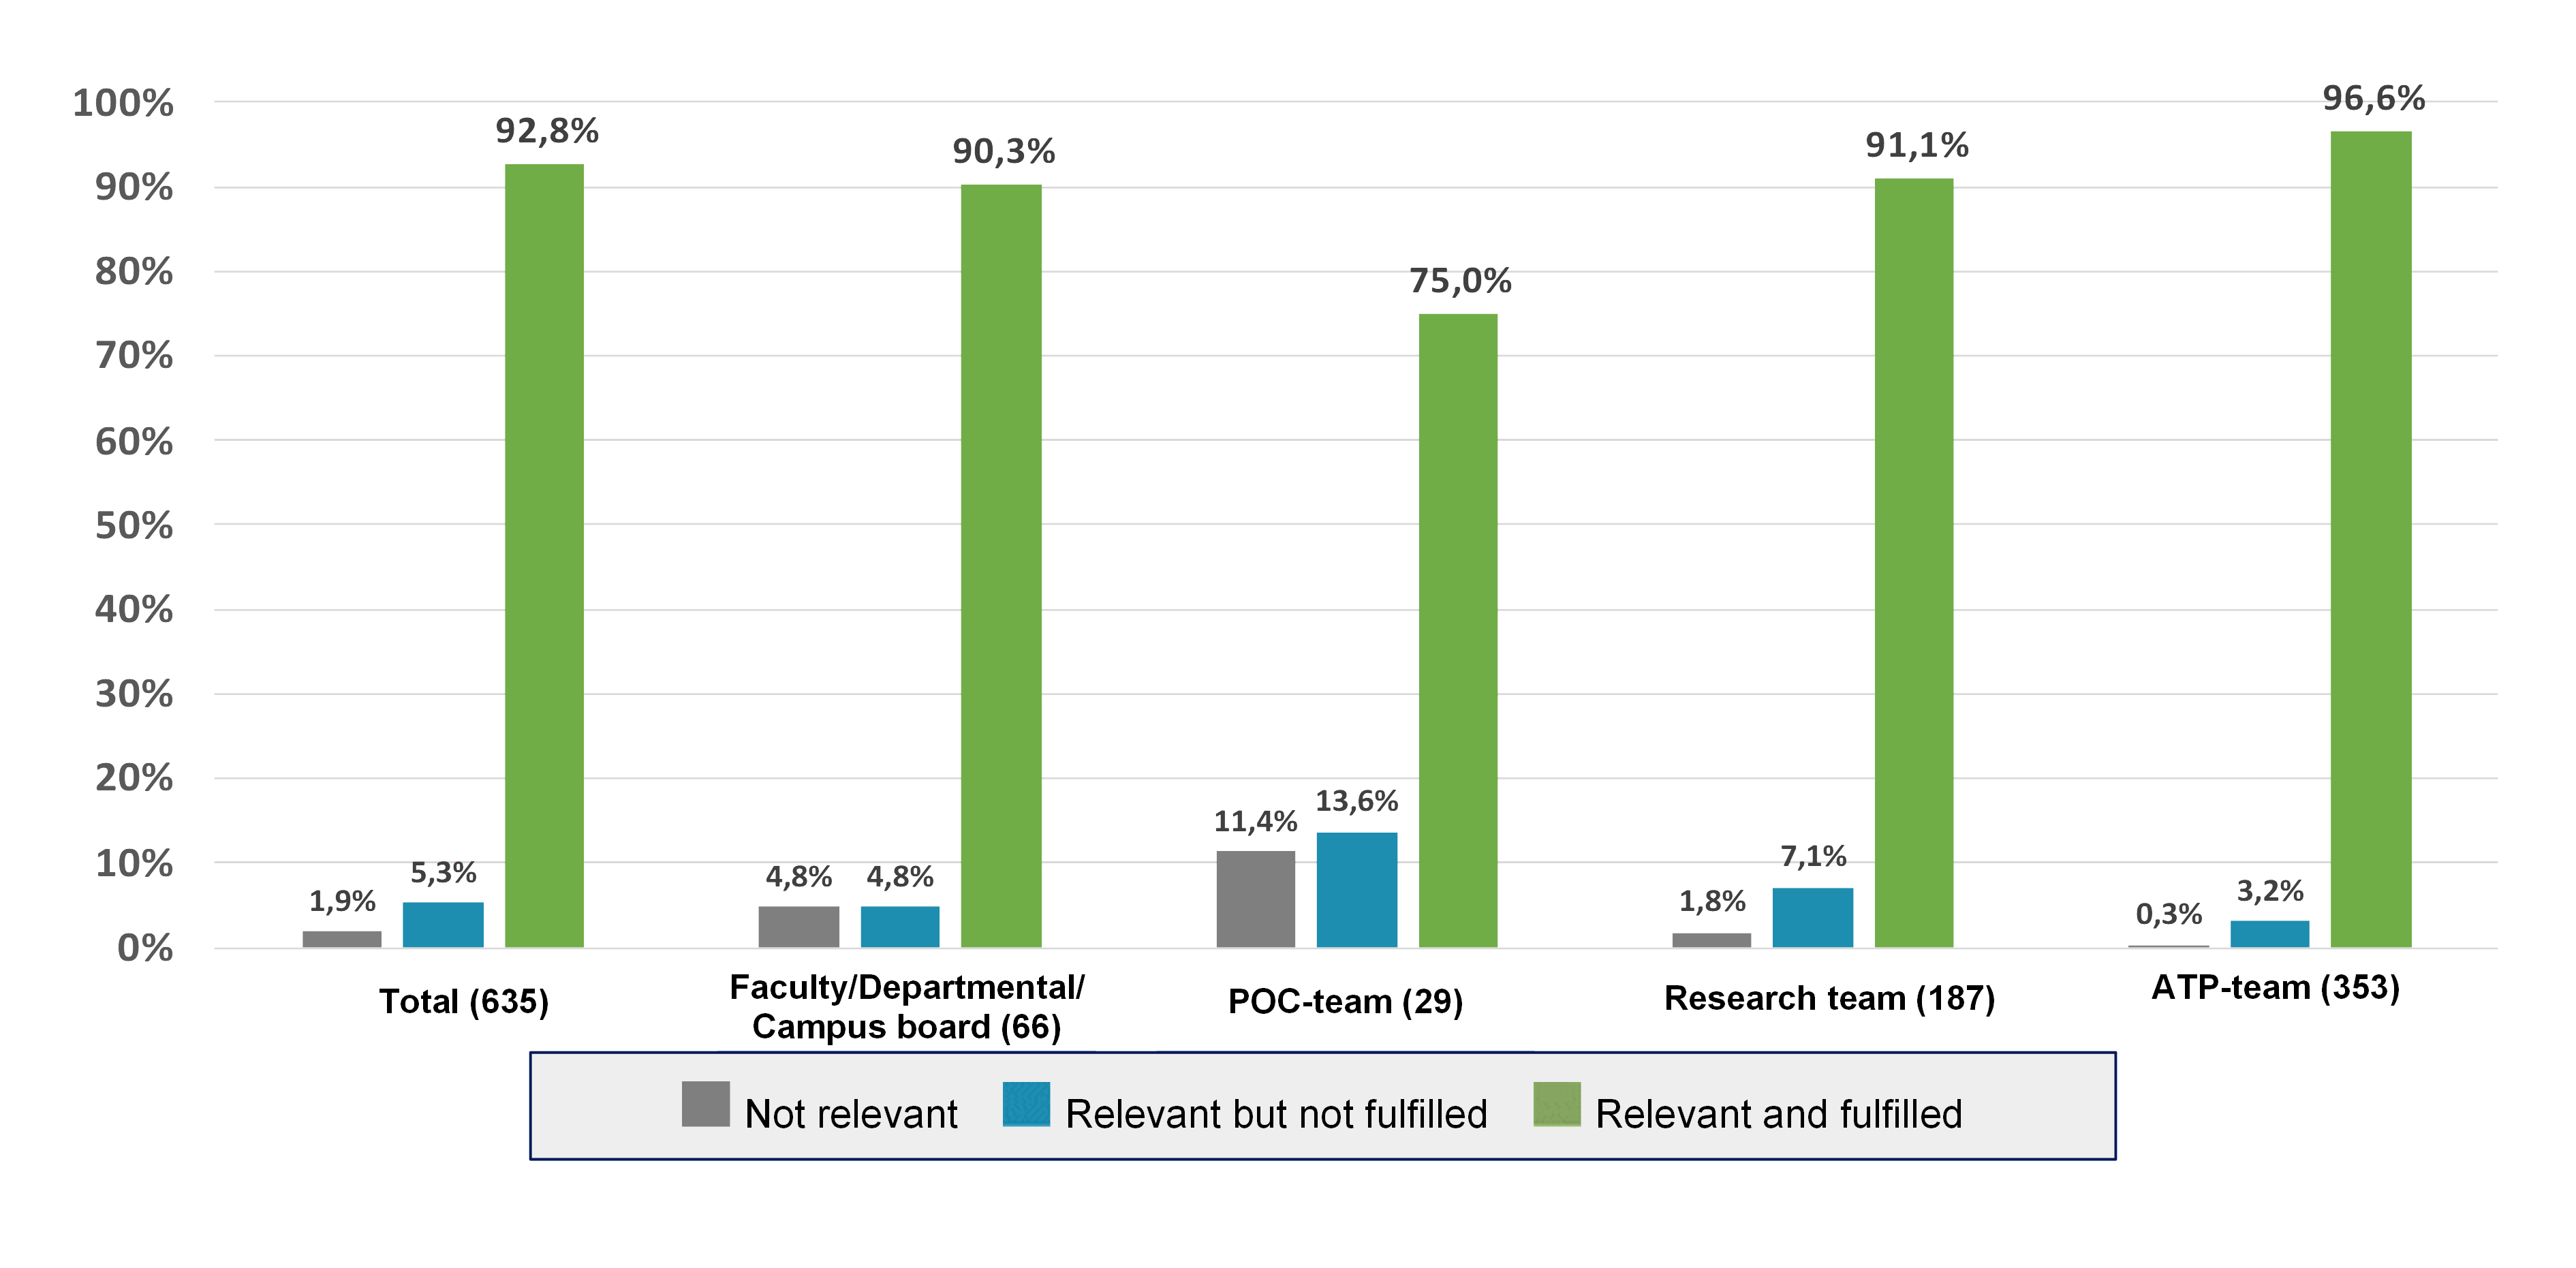
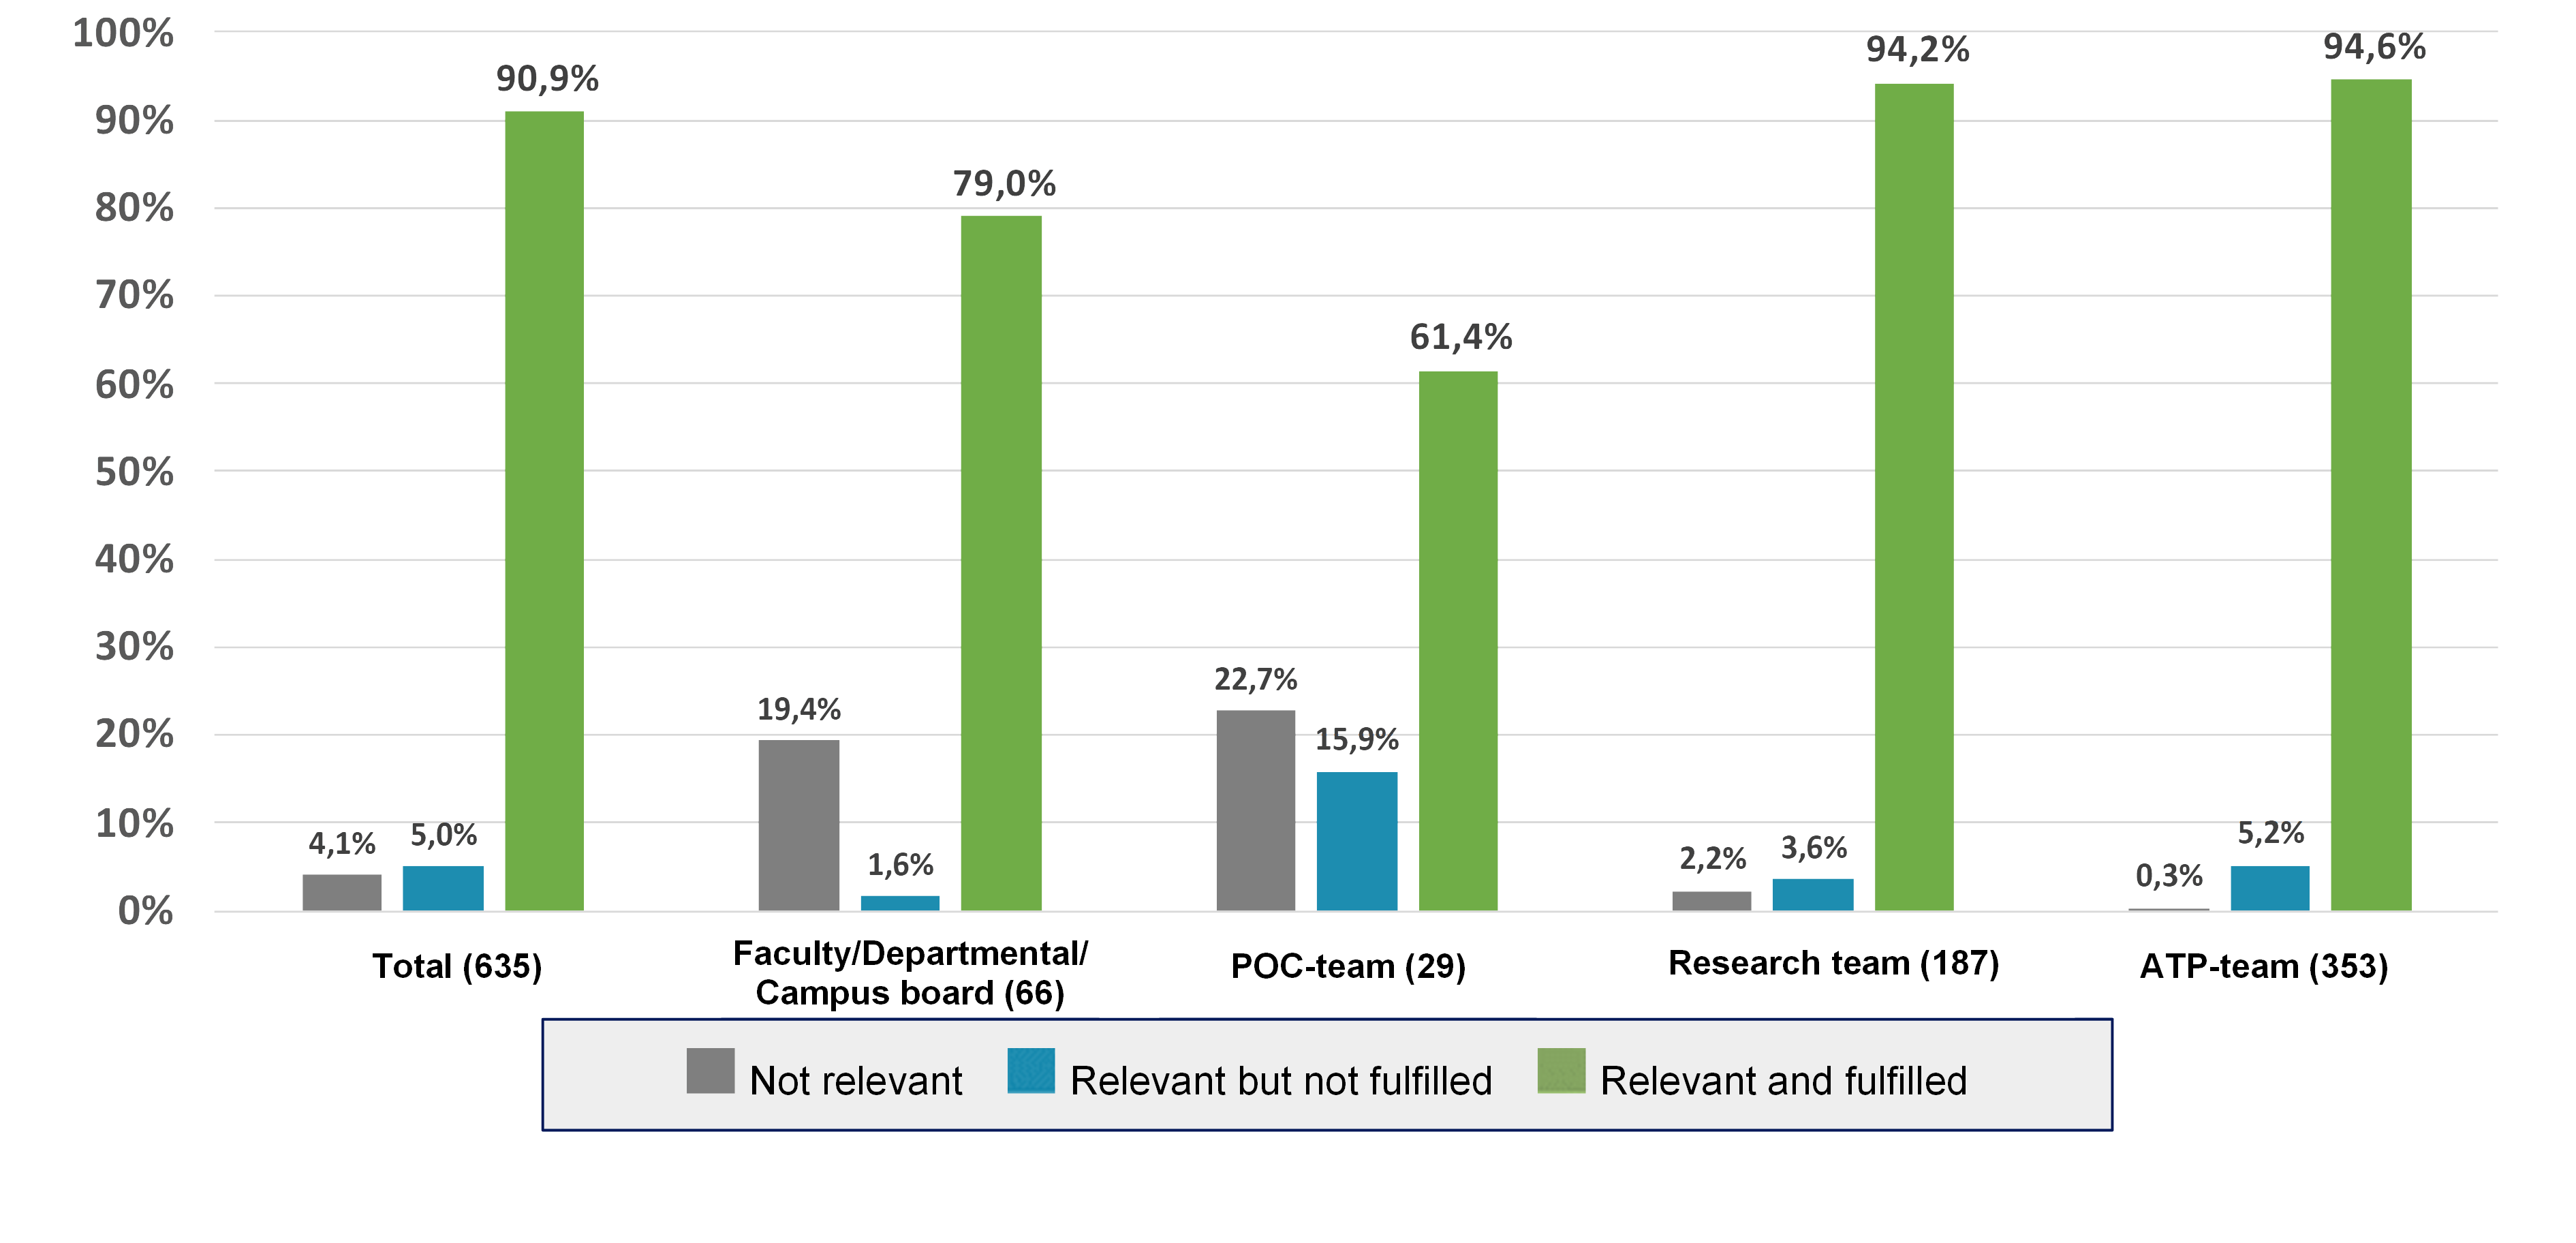
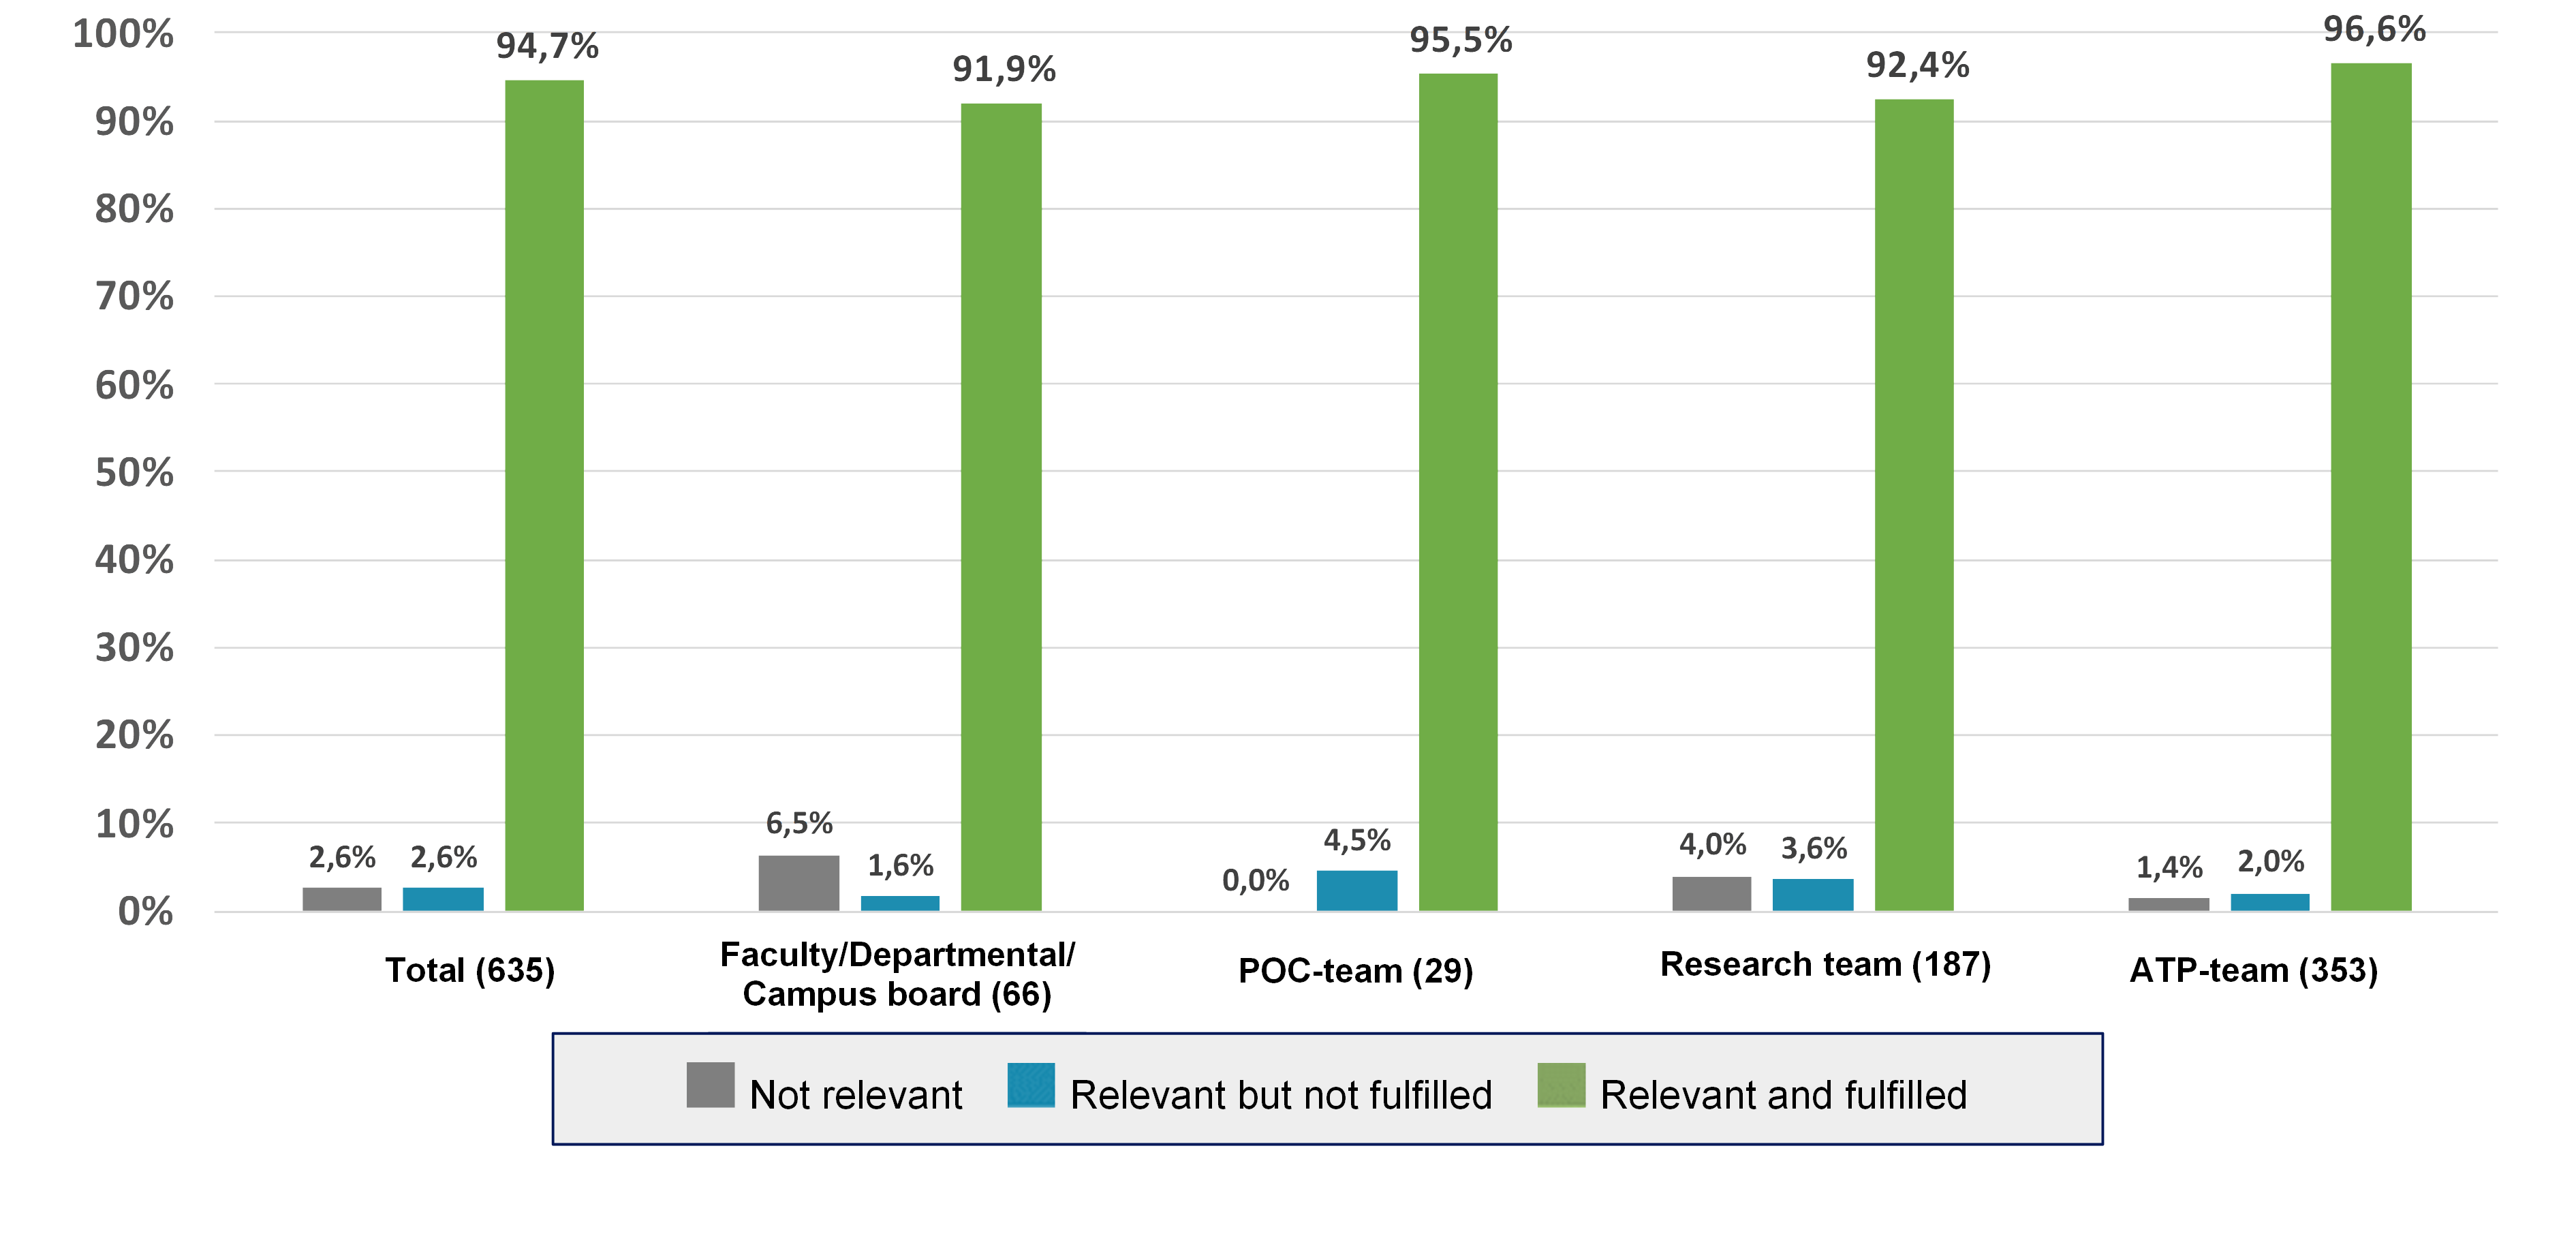
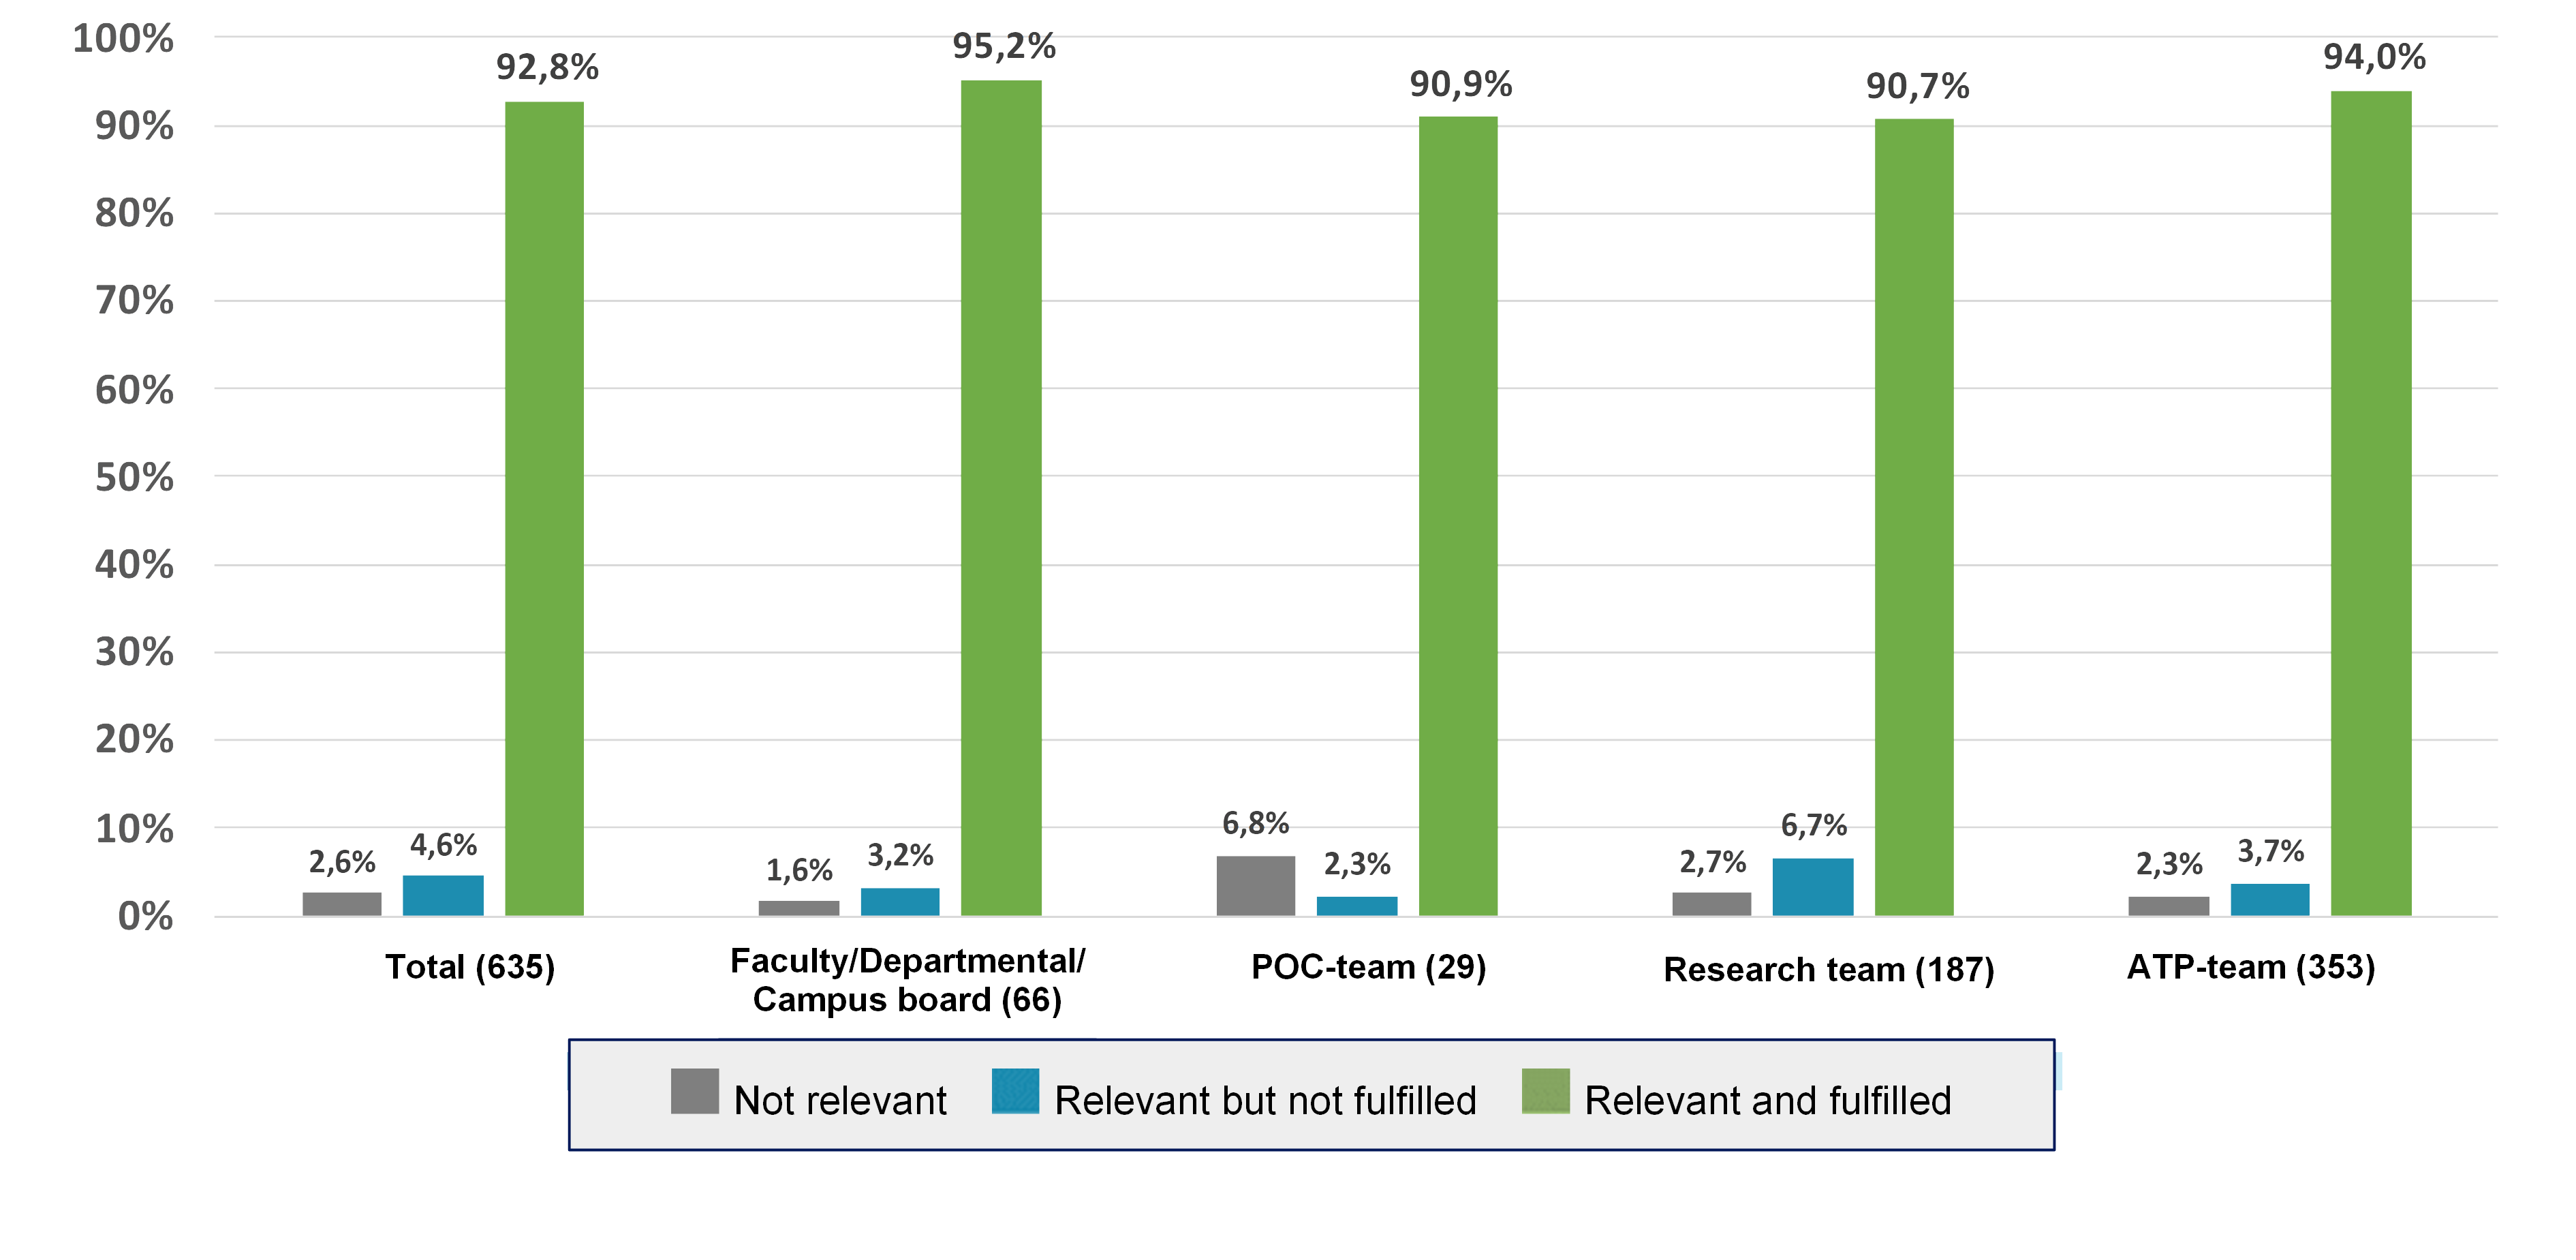
The subsequent graphs depict the questionnaire responses, offering visual representations of the frequency of participants indicating that a leadership role was not relevant, relevant but not fulfilled by the formal leader, or relevant and fulfilled. The initial bar graph presents the overall results, while the subsequent four bar graphs represent the outcomes for each specific type of team, namely board teams, POC-teams, research teams, and ATP-teams.
The external leader
The social leader
The conflict-resolution leader
The participative leader
The adaptive leader
The directive leader
The self-critical leader
The well-being leader
The team development leader
The task leader
The motivational leader
The empowering leader
The self-developing leader
The psychological safety leader
The team-oriented leader
The exemplary leader
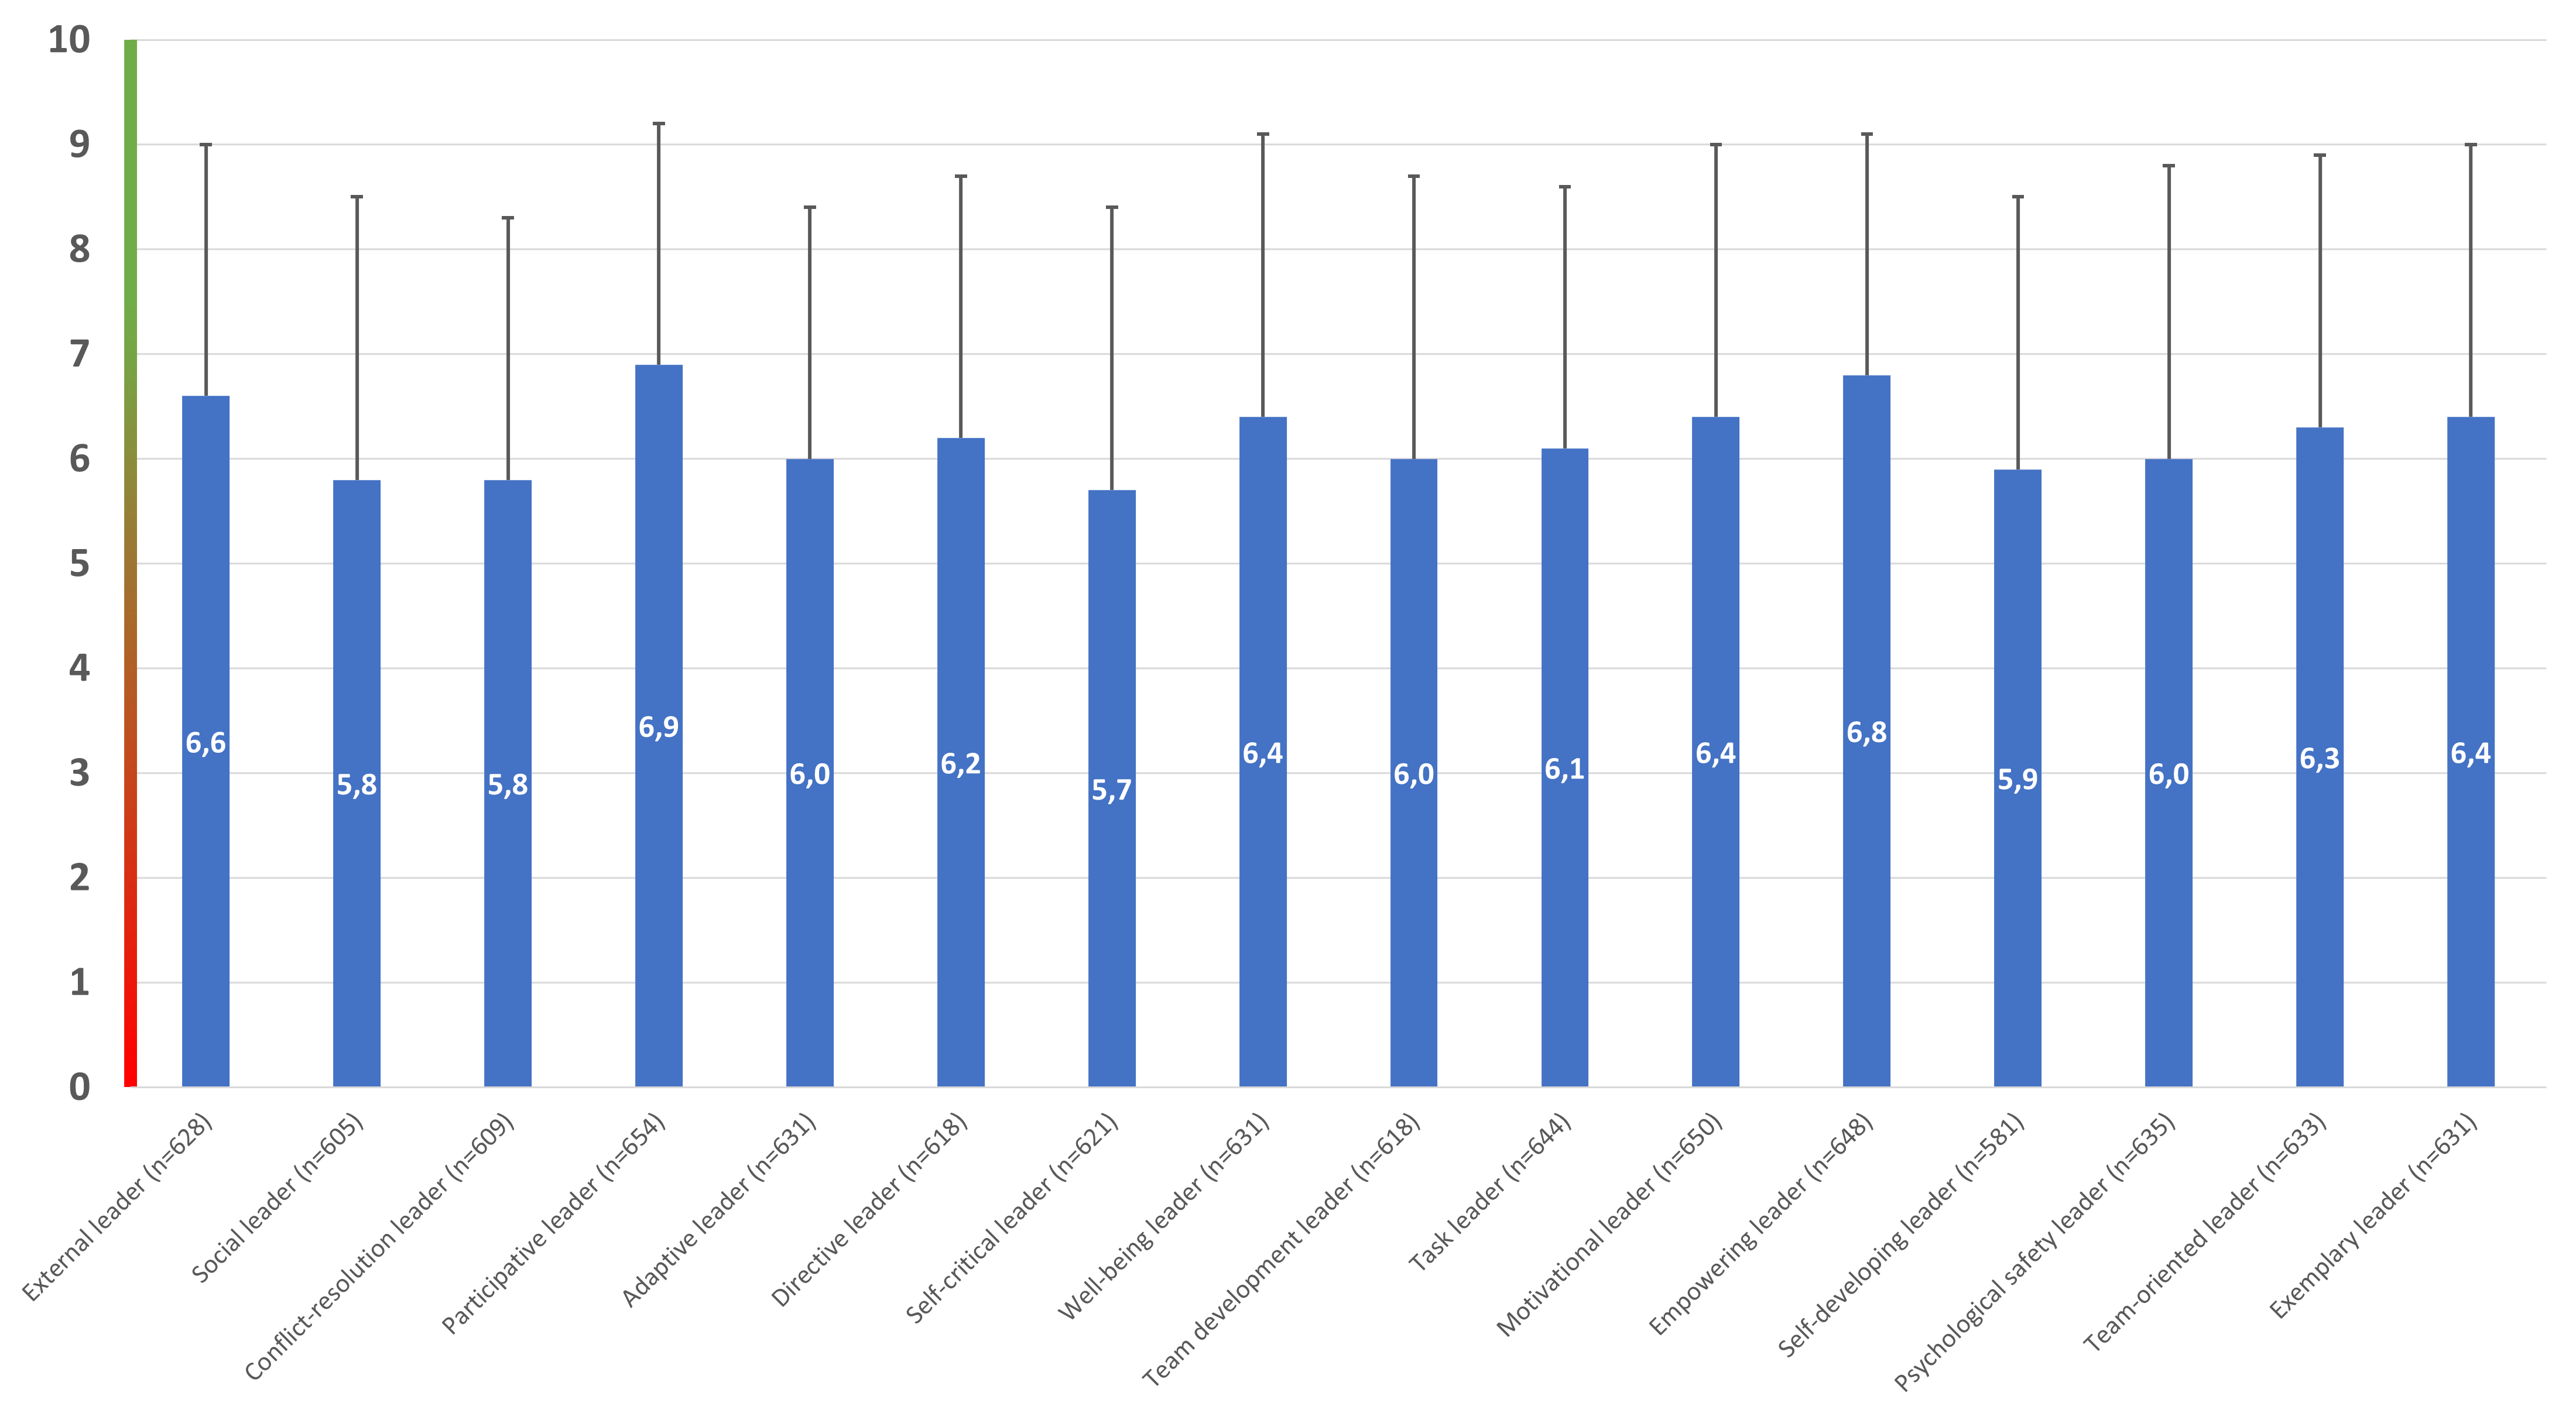
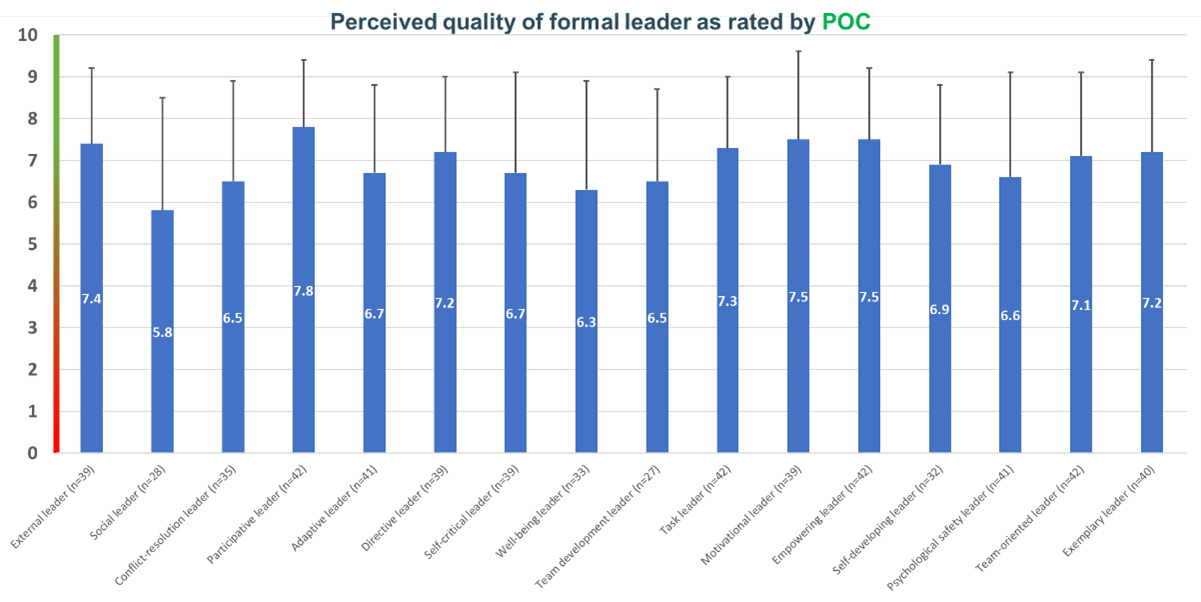
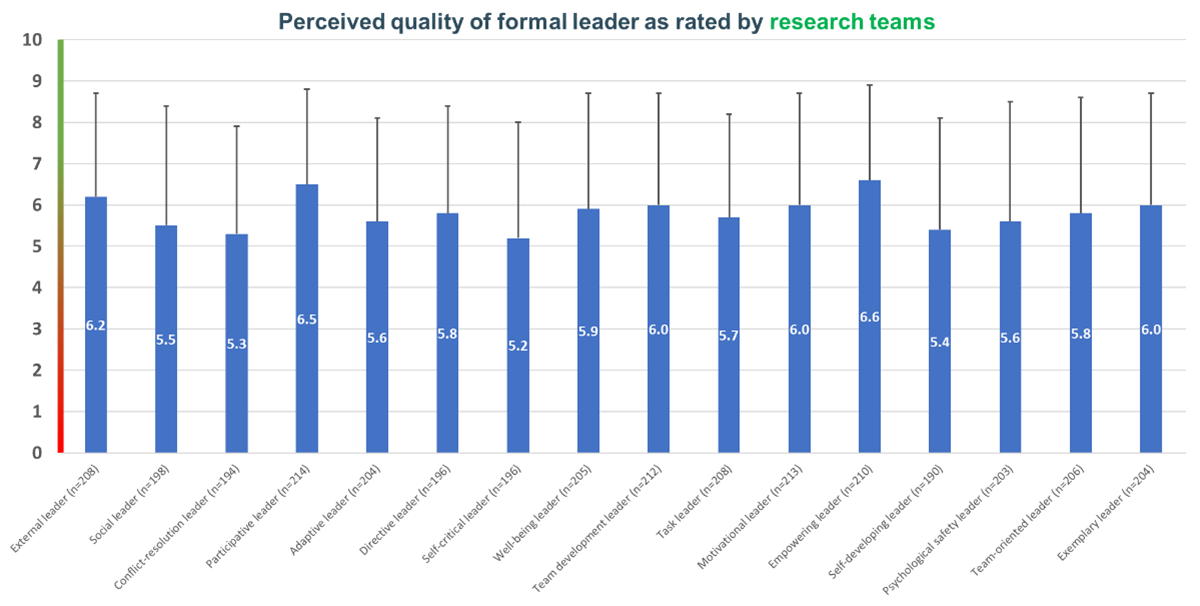
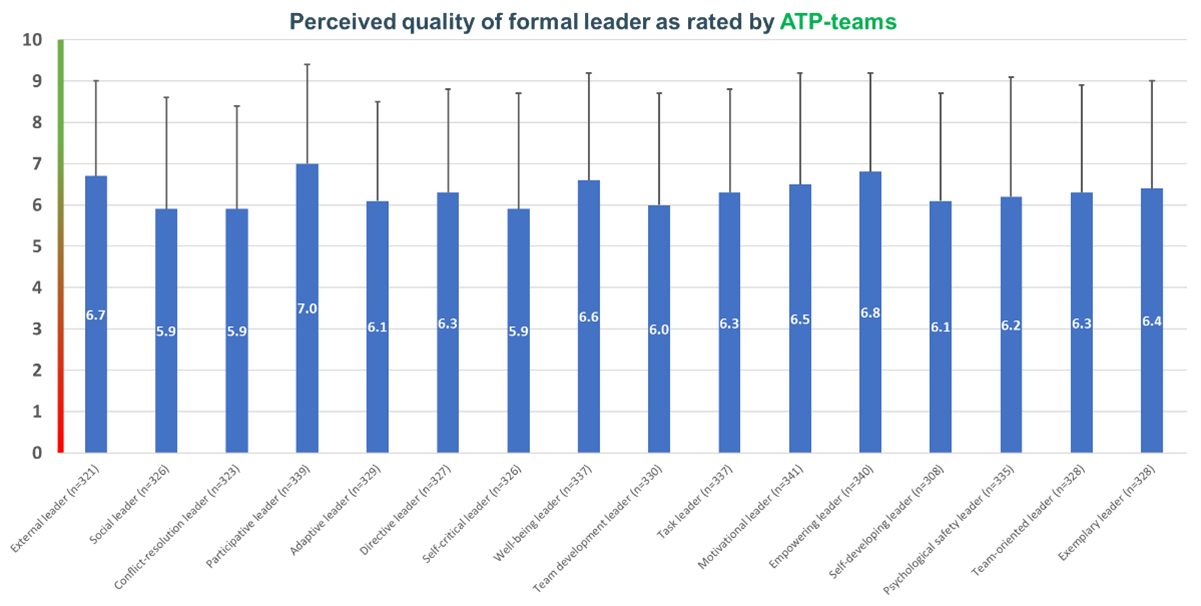
Perceived quality of formal leadership roles
The subsequent graphs illustrate the average perceived quality of formal leadership roles. Error bars are incorporated to represent the standard deviations. These averages ranged from 5.8 to 6.9, measured on a scale from 0 to 10.
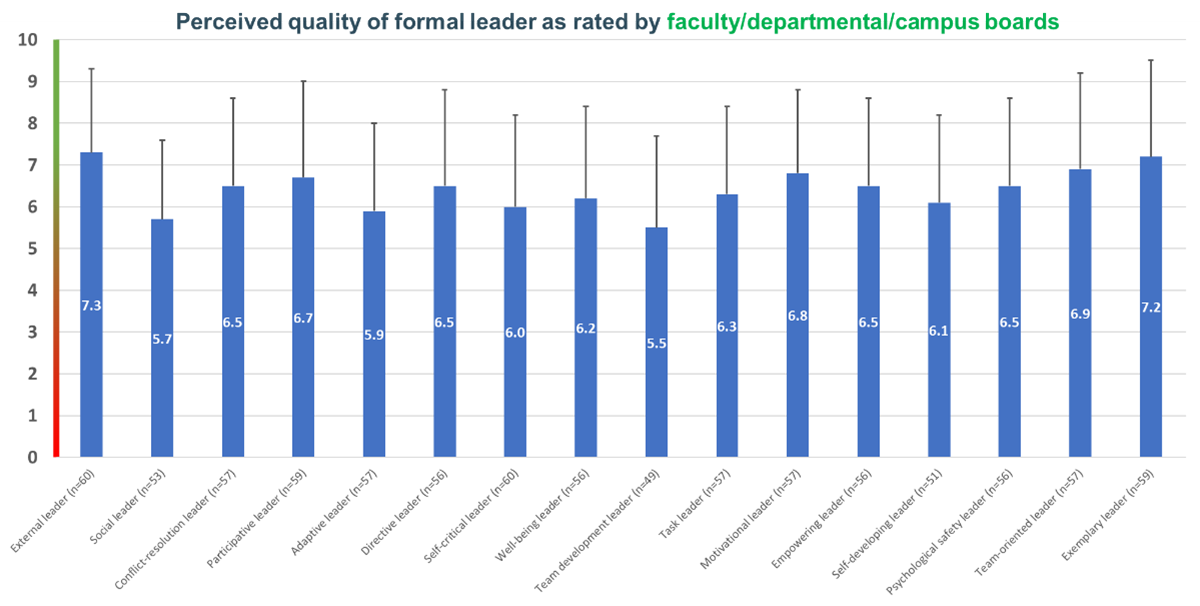
The following graphs depict the average perceived quality of formal leadership roles for board teams, POC-teams, research teams, and ATP-teams. Error bars are incorporated to represent the standard deviations.
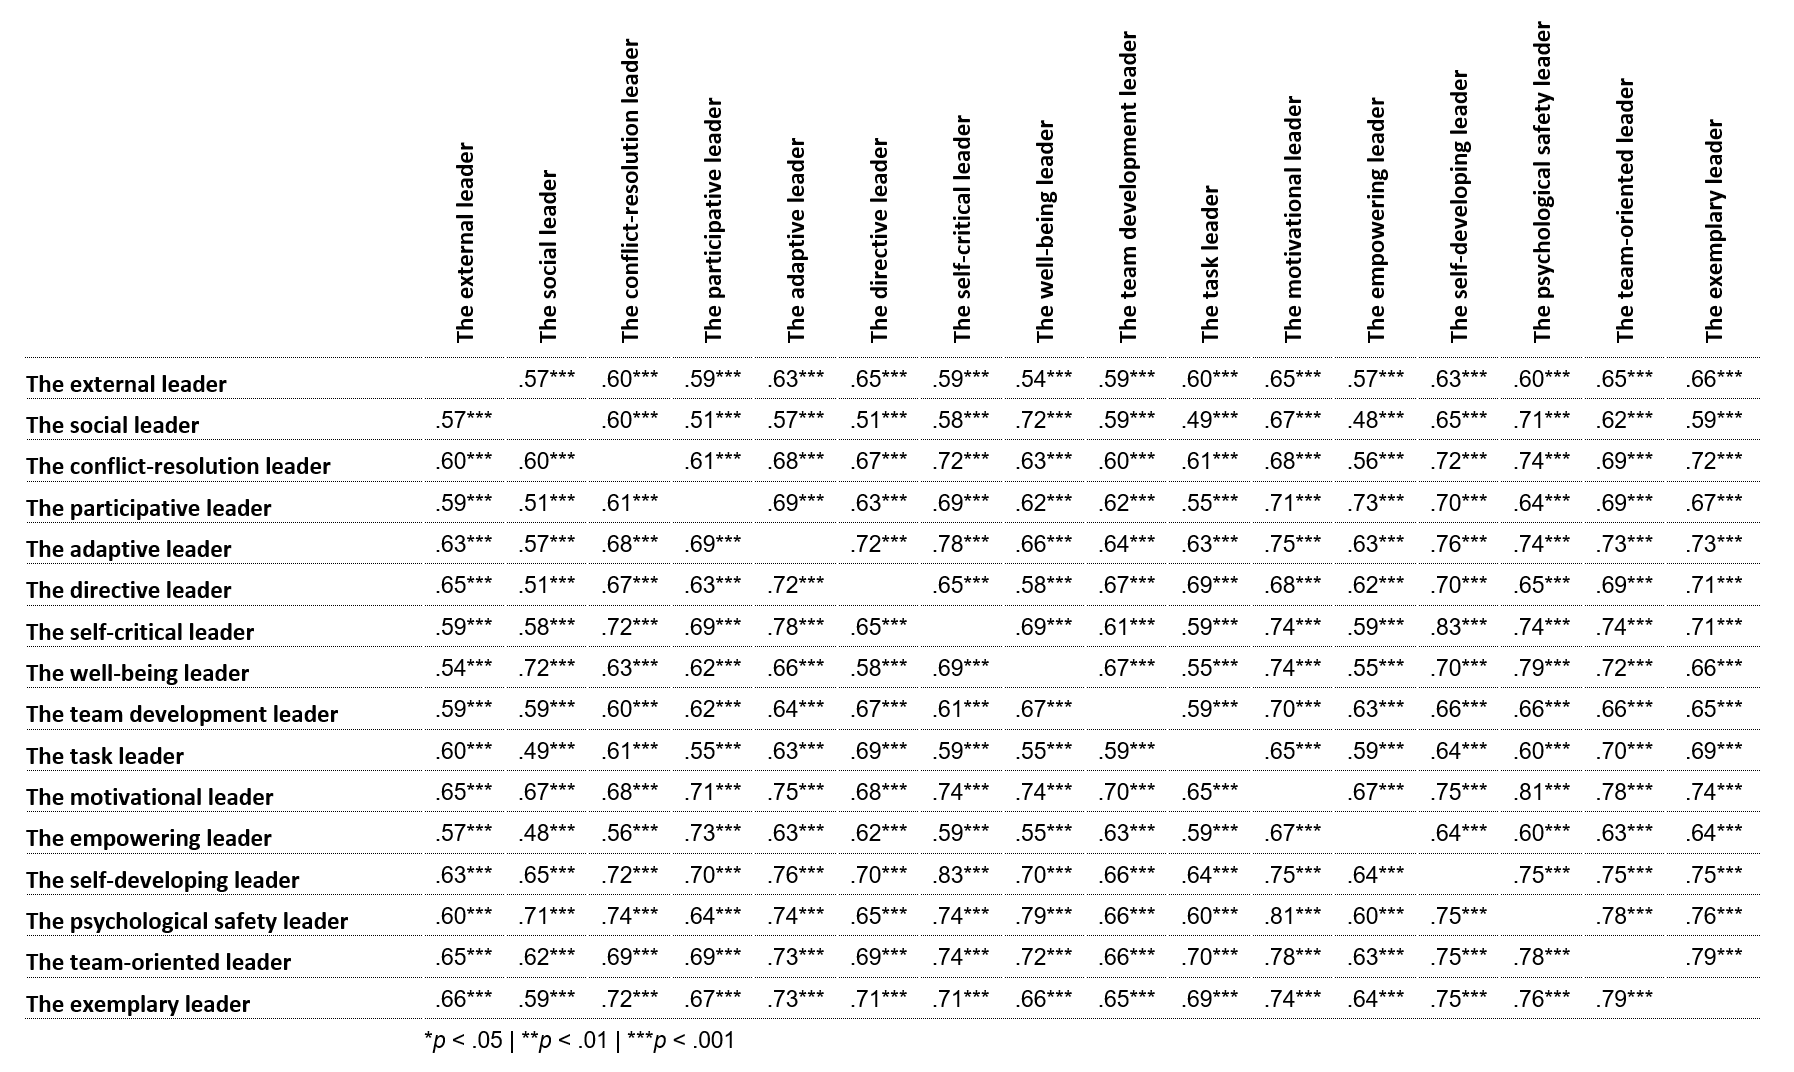
Relation between the different formal leadership roles
This table represents the correlations between the different formal leadership roles. These findings show a moderate to high interconnectivity between formal leadership roles (with most correlations falling between .50 and .80). With a moderate to high interconnectivity being observed between the different formal leadership roles, these findings suggest that, while being related, these leadership roles are distinct constructs.
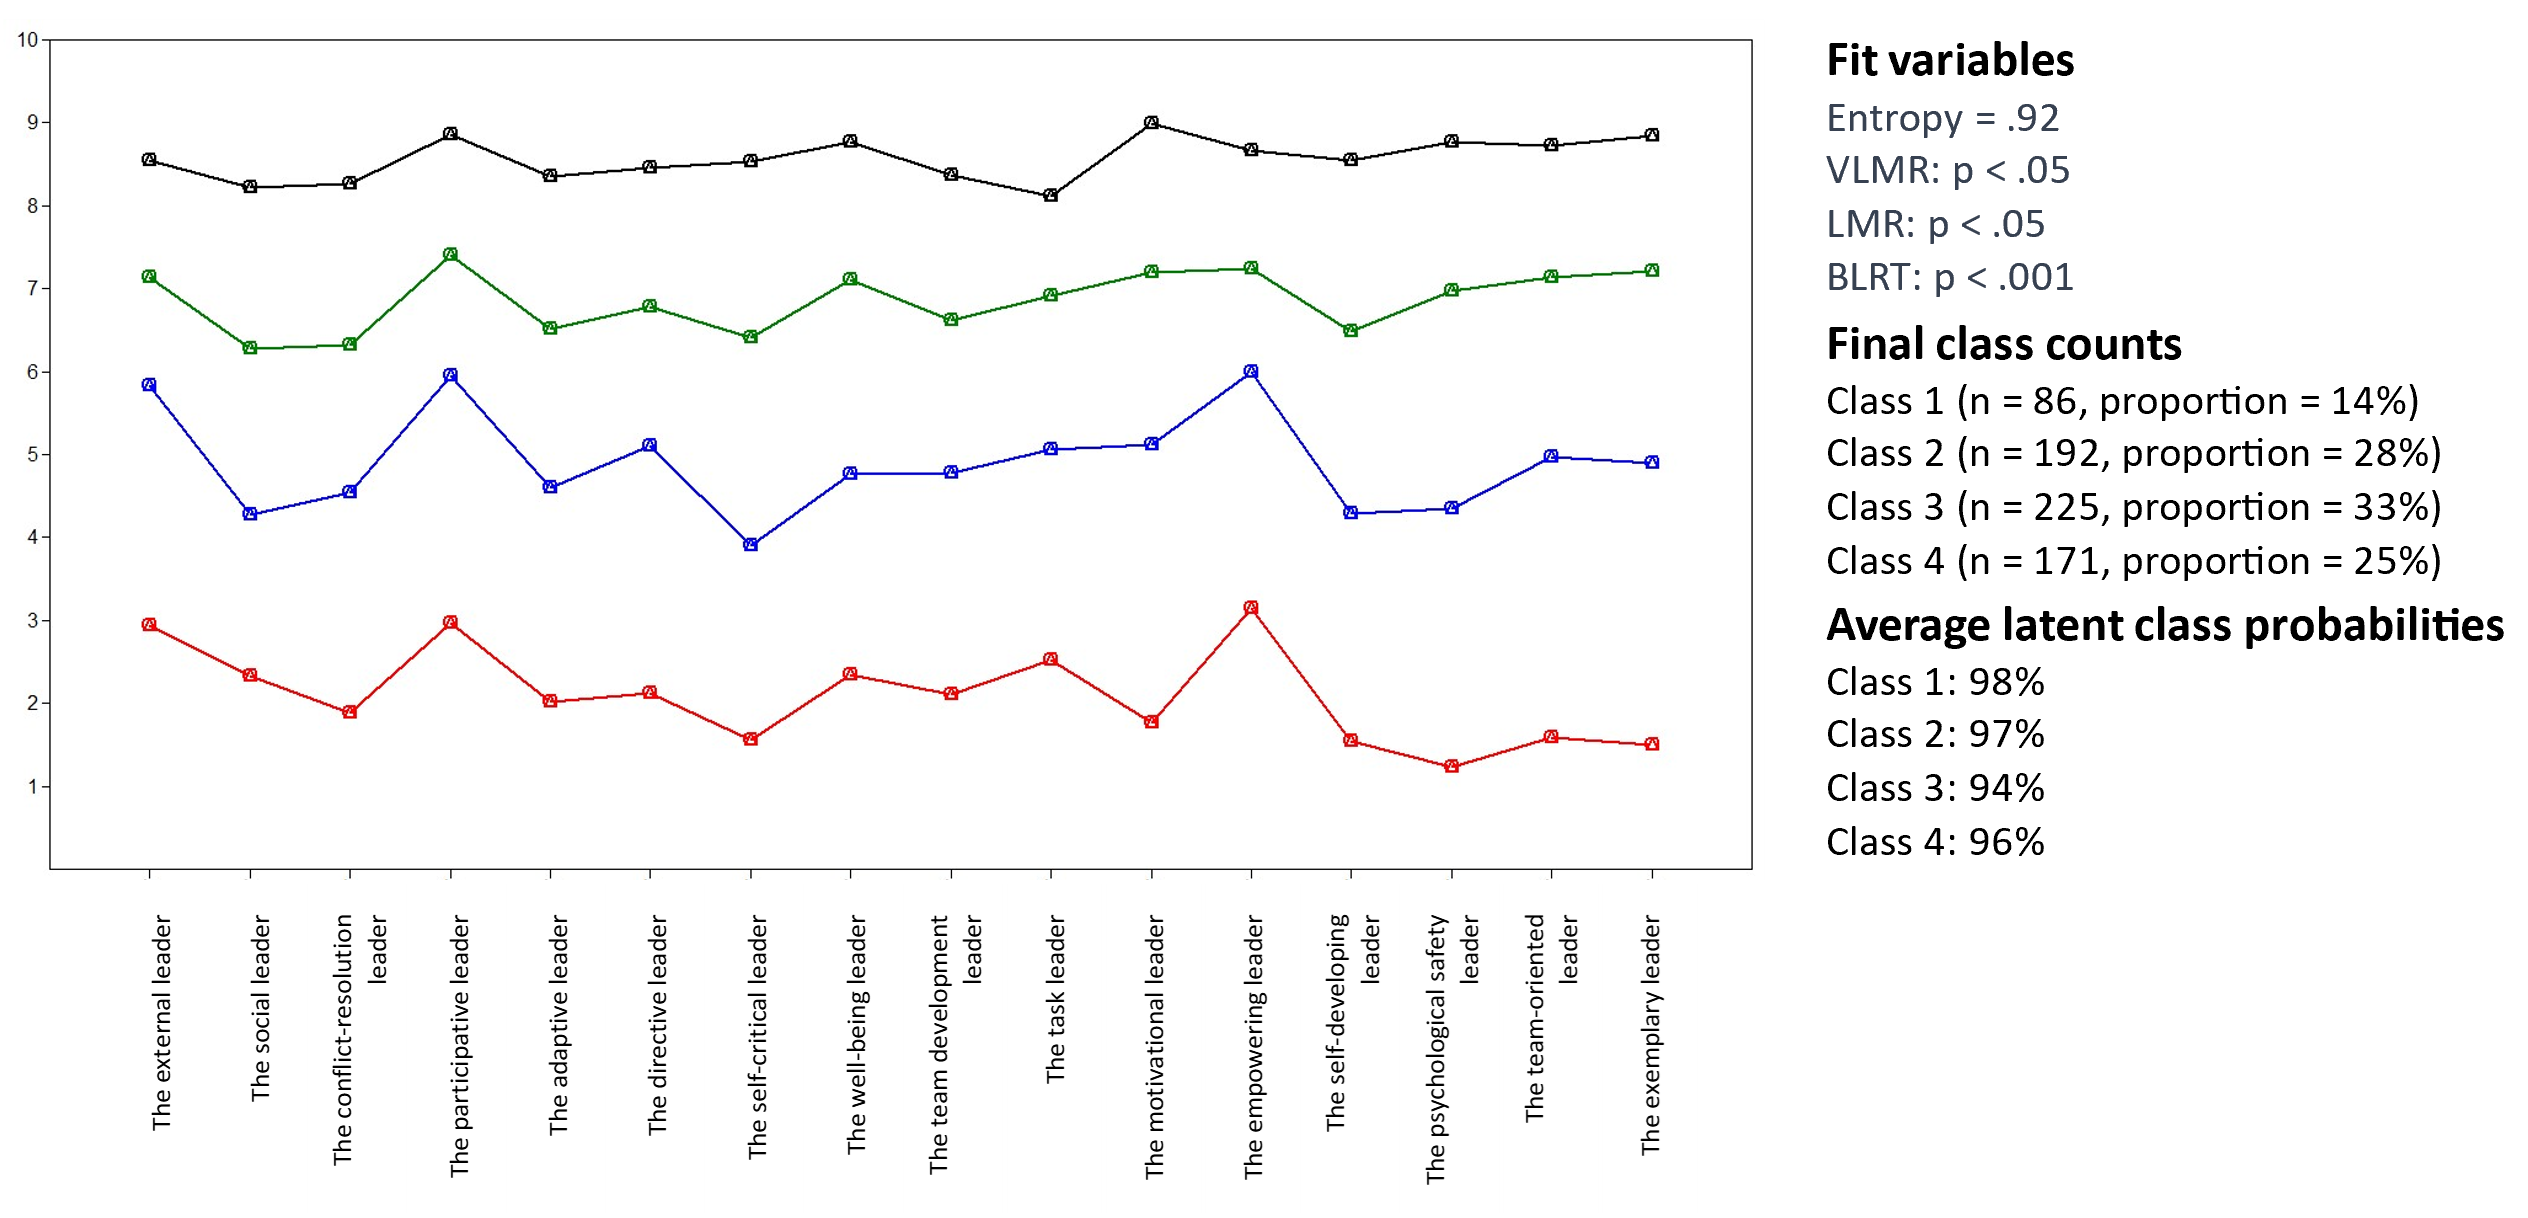
Latent profile analysis
Next, we performed latent profile analyses using M-plus, in order to identify underlying latent profiles or distinct patterns of leadership behaviour. By conducting latent profile analyses, we aimed to identify potential distinct combinations or configurations of leadership roles that tend to co-occur together.
In our analysis of formal leadership roles, the latent profile analyses revealed that formal leadership roles tend to co-occur together and were occupied either all with high quality (black line), all with medium quality (green and blue line), or all with low quality (red line). In other words, when a few formal leadership roles were fulfilled with high quality in our sample, it is likely that the other leadership roles were also perceived as being fulfilled with high quality. Overall, we could not identify any other unique leadership combinations (e.g., teams with high task-related leadership roles and low social-related leadership roles).