Descriptive data peer leadership roles
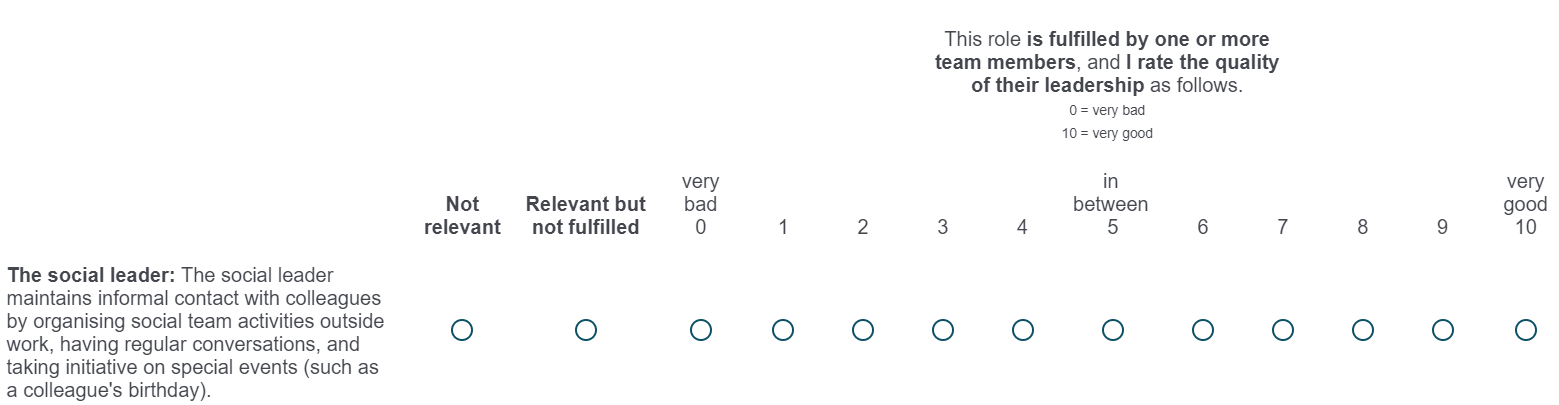
When participants were answering questions relating to leadership behaviours and roles, they had to carefully consider their response. For each leadership behaviour and leadership role, participants had three options:
- This behavious/role is not relevant in the context of my team.
- This behaviour/role is relevant, but is not shown by team members.
- One or more team members fulfill this behaviour/role, and I rate the quality of their leadership.
To facilitate participant responses, we employed a multiple-choice system. An example of how this appeared on the Qualtrics platform is provided in the image below:
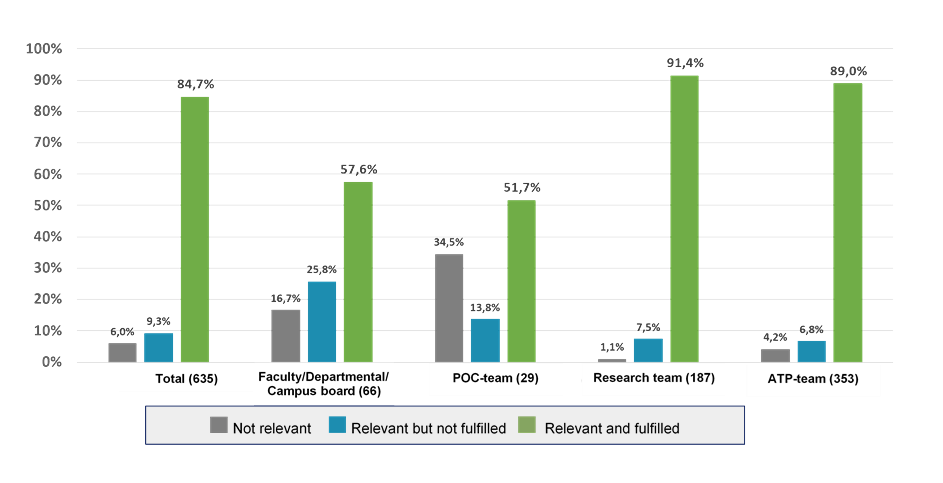
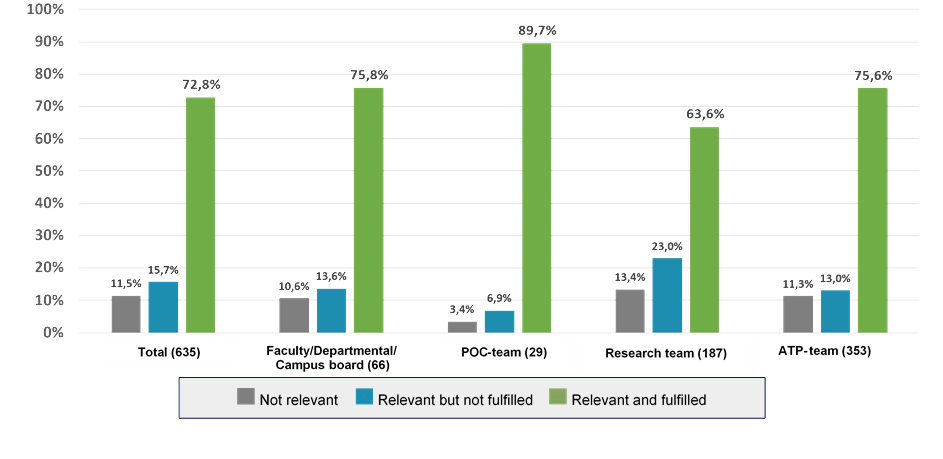
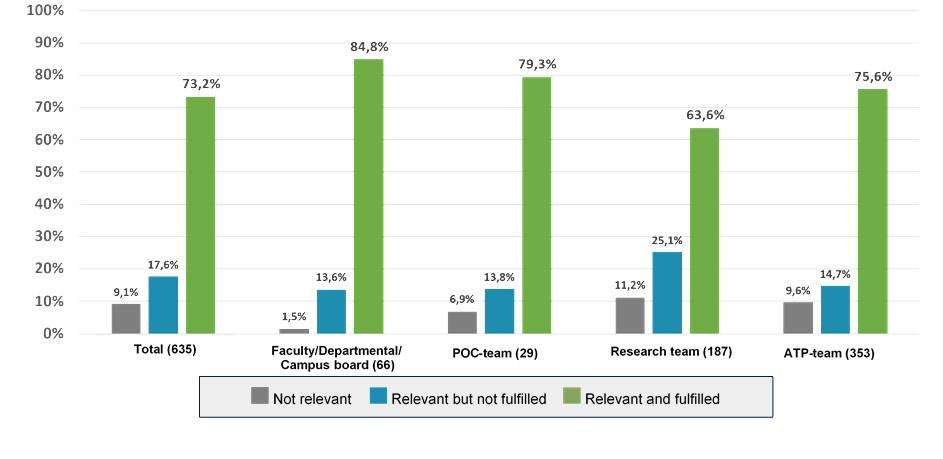
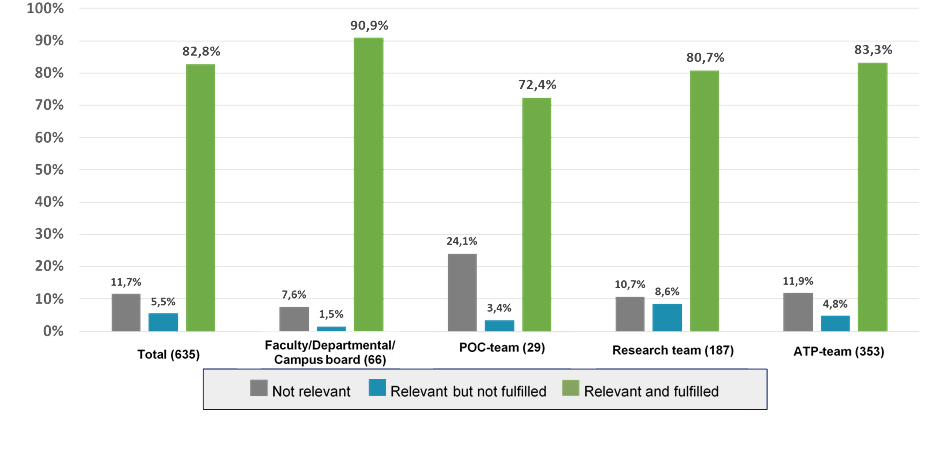
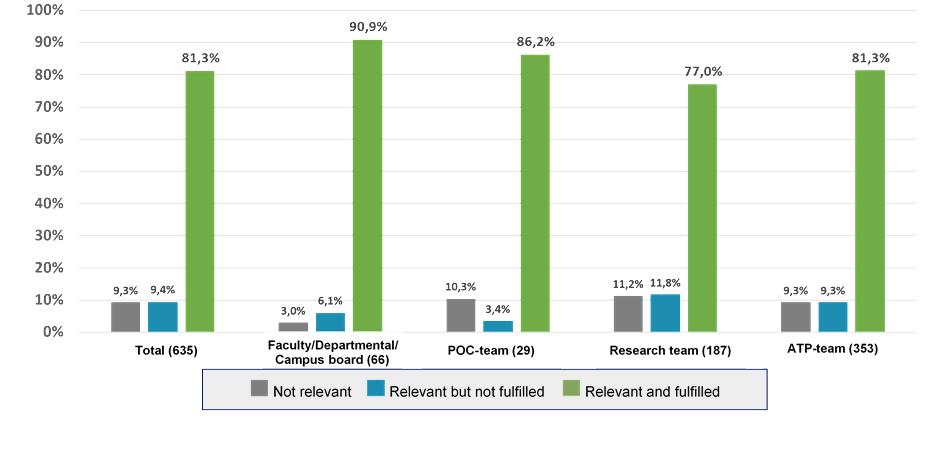
Relevance of peer leadership roles
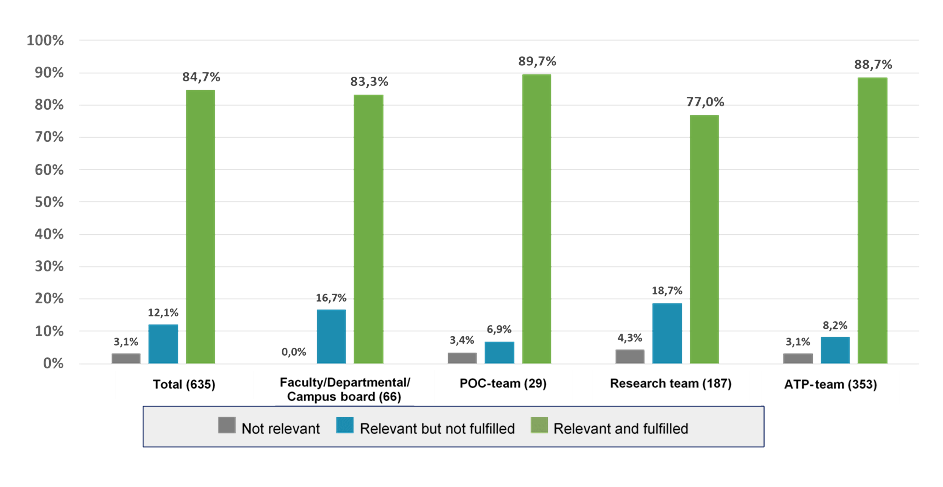
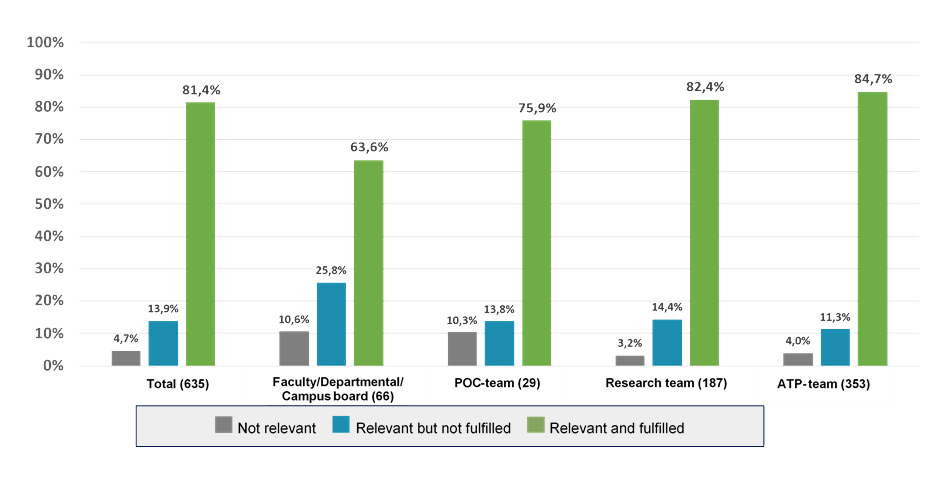
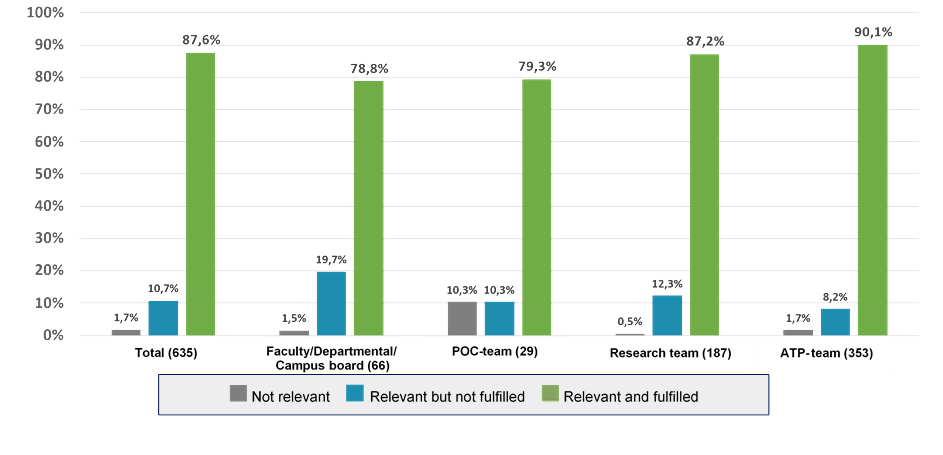
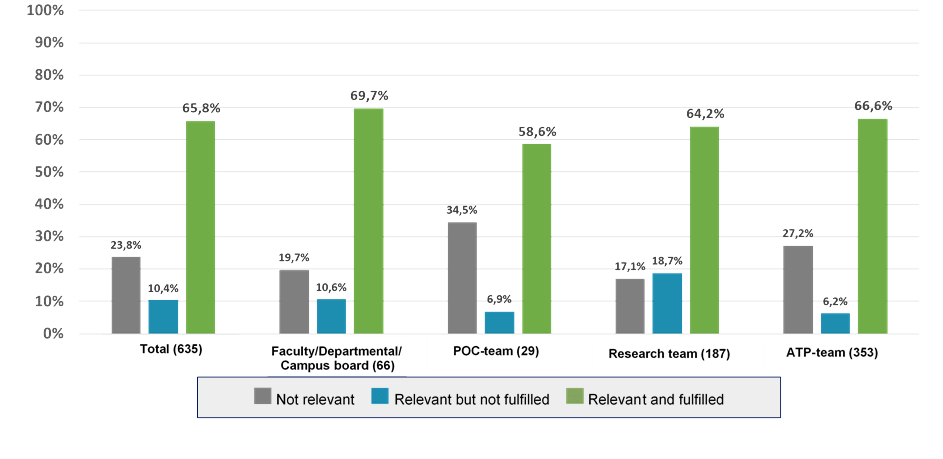
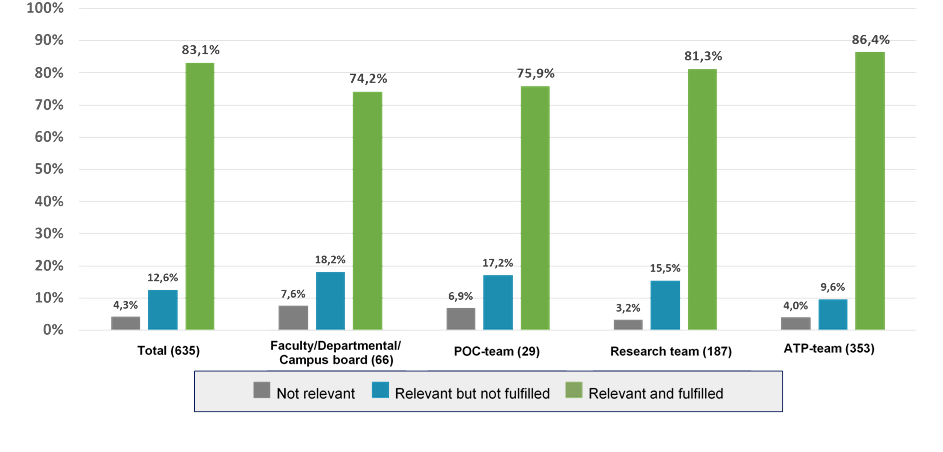
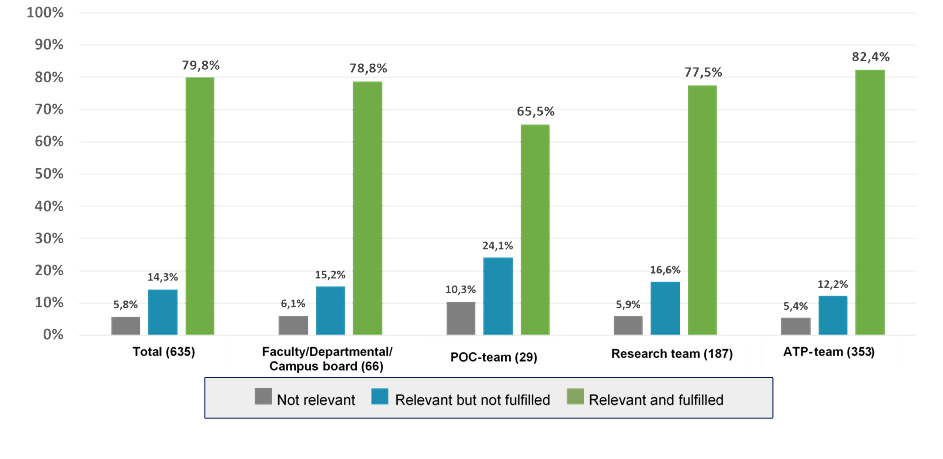
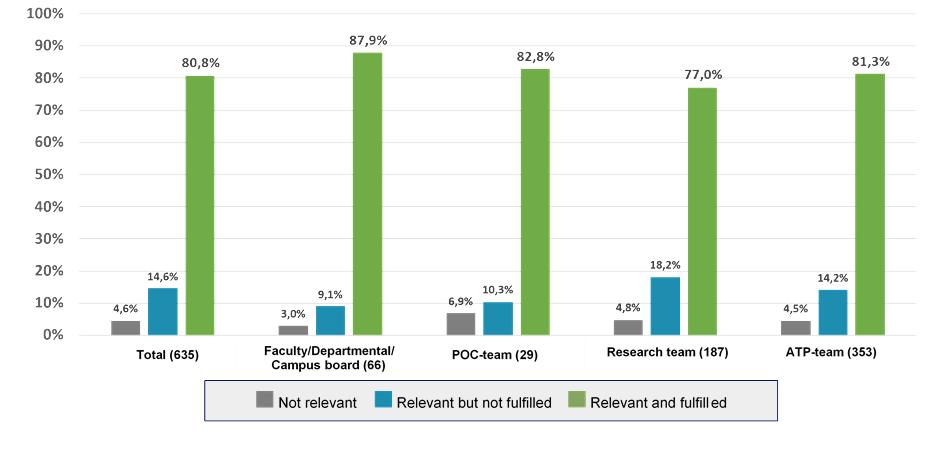
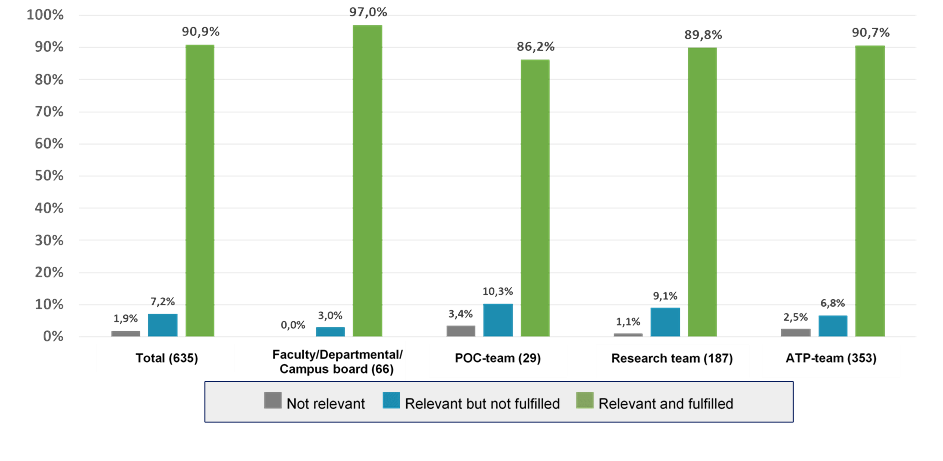
The subsequent graphs present the questionnaire responses, providing visual representations for how many participants considered the roles to be not relevant, relevant but not fulfilled, and relevant and fulfilled. To illustrate, 6% of participants in the total sample perceive the role of the social leader as not relevant; 9.3% consider the role of social leader as relevant, but indicate it is not fulfilled in their team; and 84.7% consider the role of social leader relevant and indicate it is fulfilled.
The social leader
The proactive leader
The innovative leader
The development leader
The welfare leader
The external leader
The liaison leader
The identity-strengthening leader
The logistics leader
The task leader
The cooperation leader
The connecting leader
The psychological safety leader
The critical leader
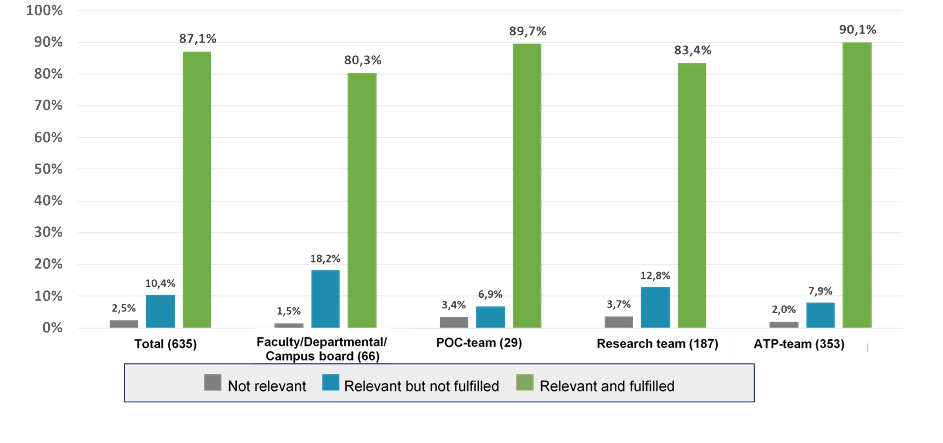
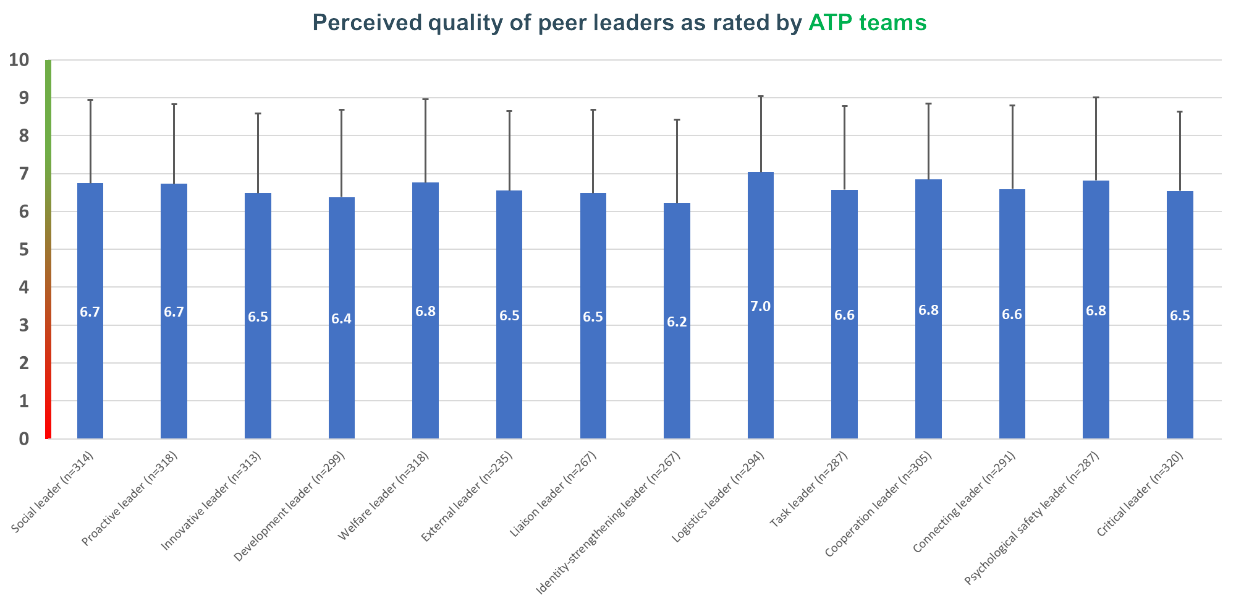
Perceived quality of peer leadership roles
The following graphs depict the average perceived quality of peer leadership roles. Error bars are incorporated to represent the standard deviations. These averages ranged from 6.1 to 7.0, measured on a scale from 0 to 10.
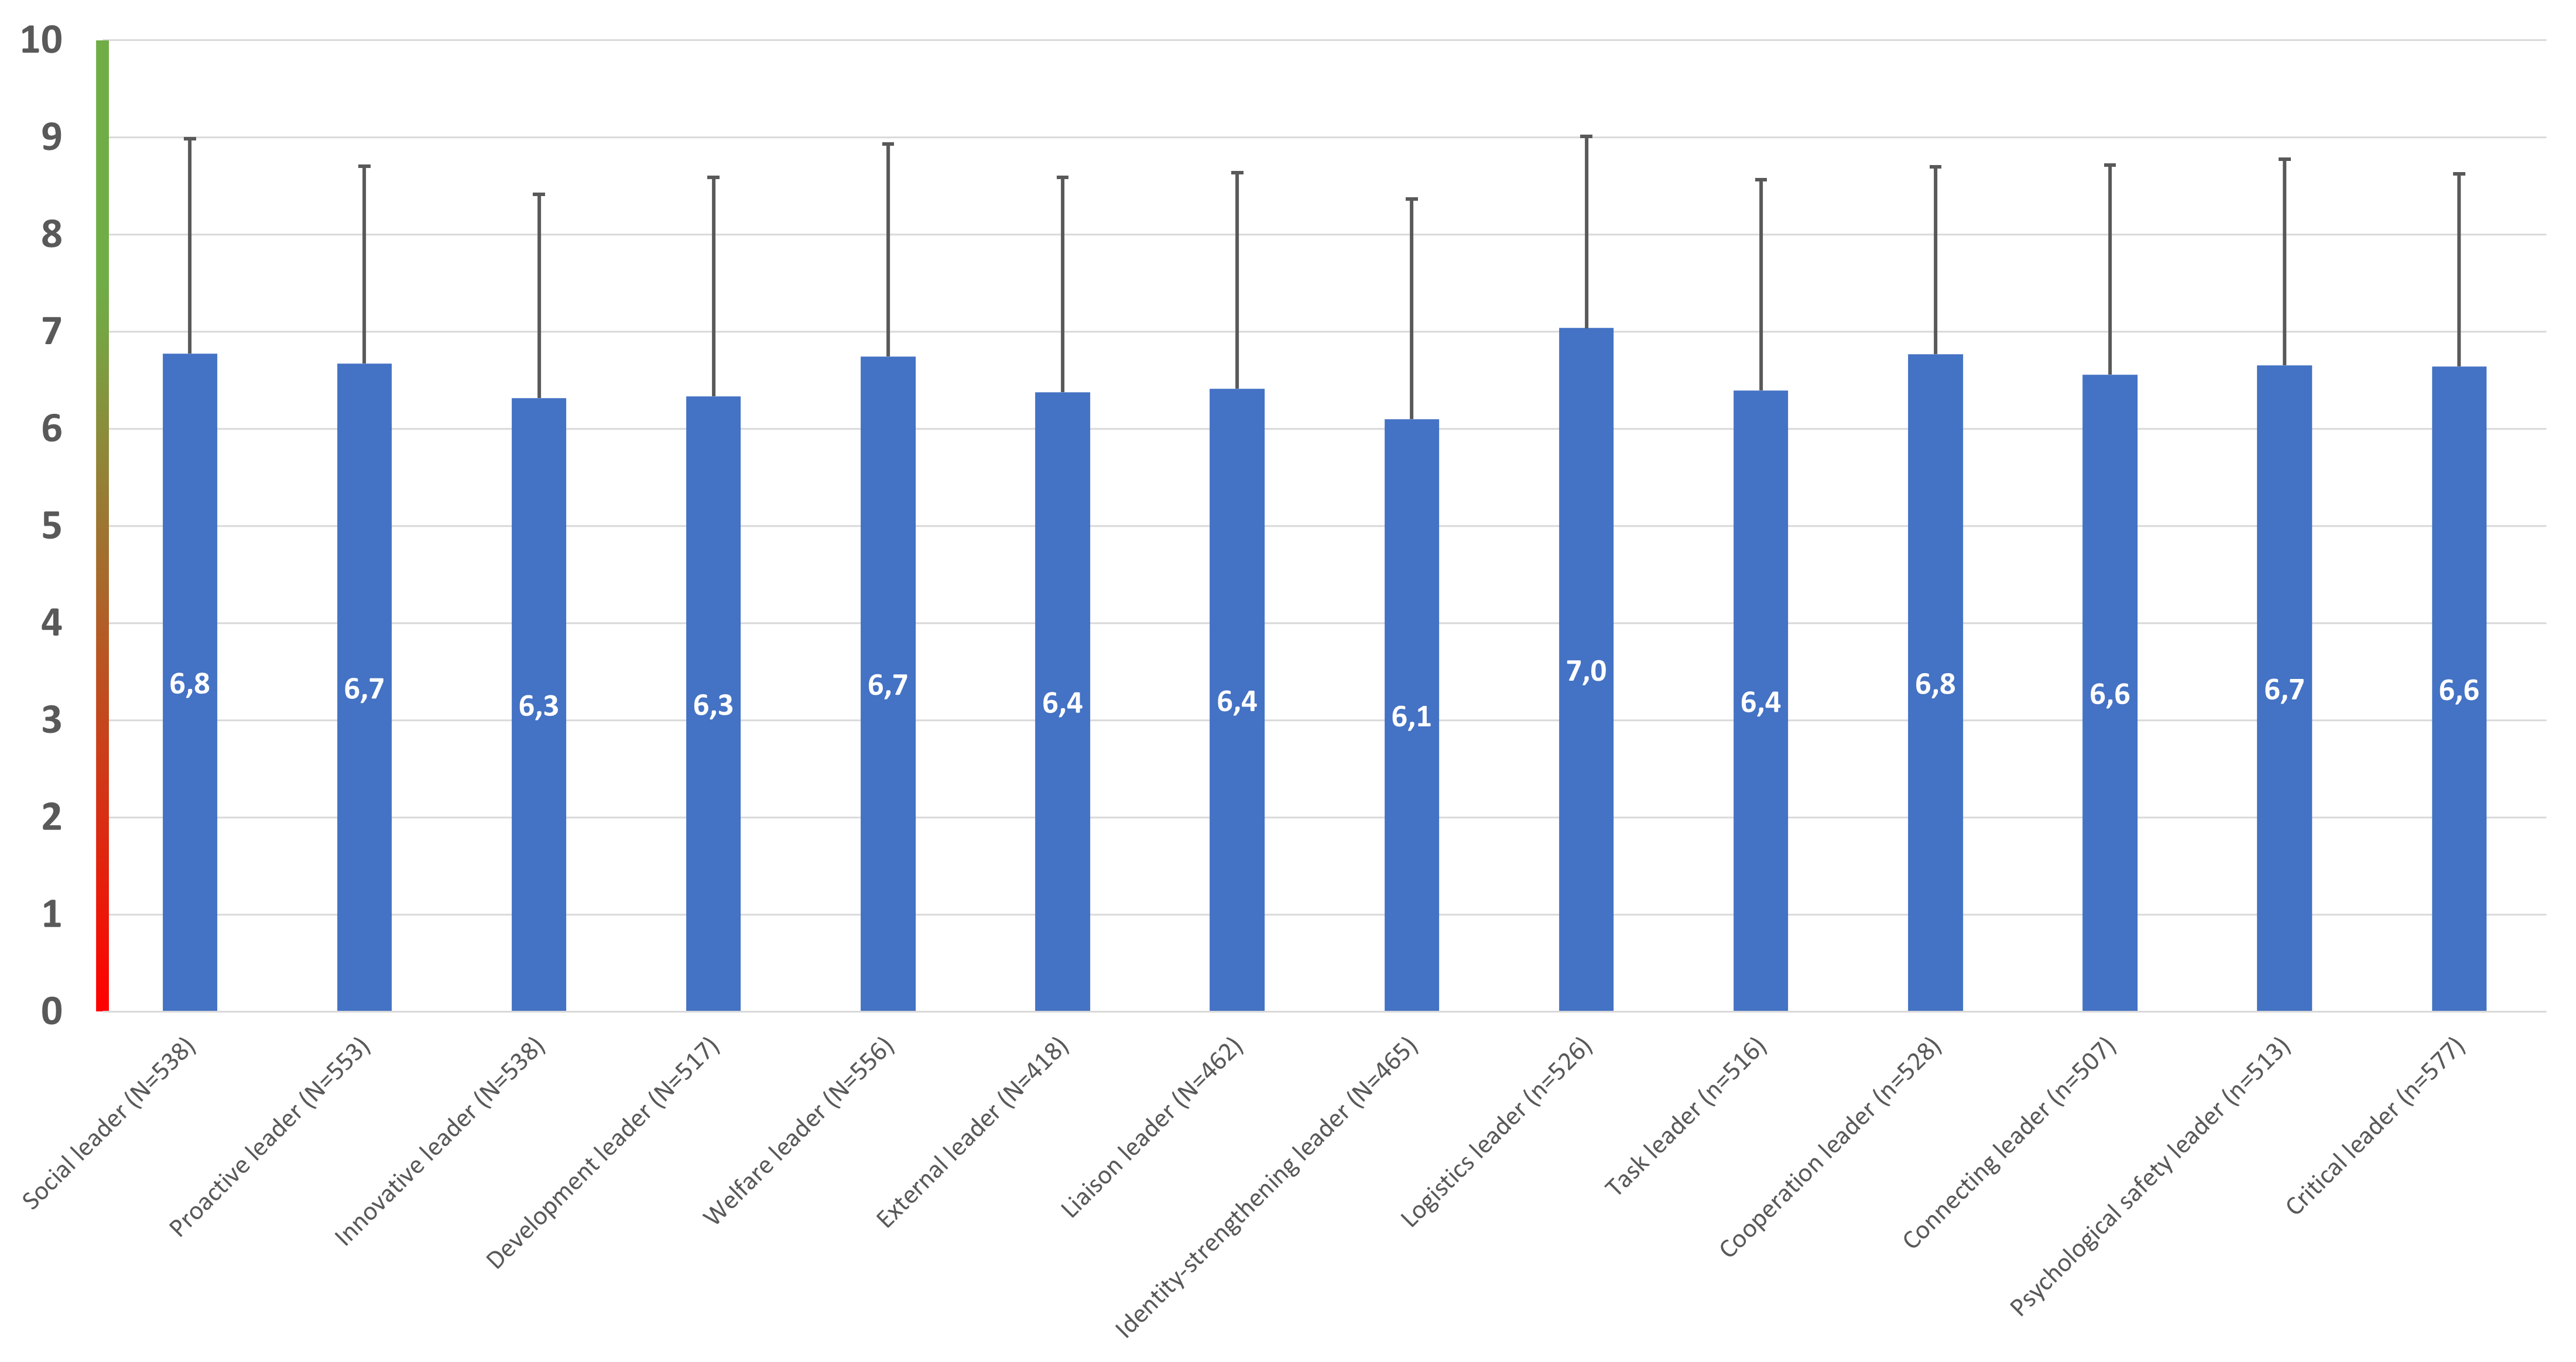
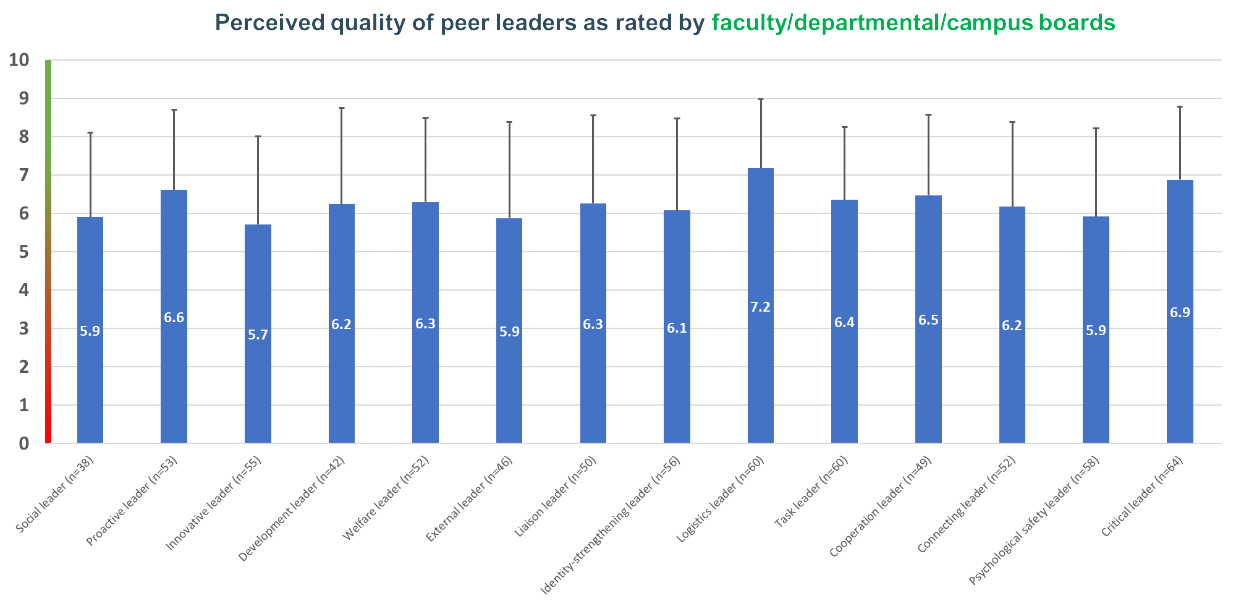
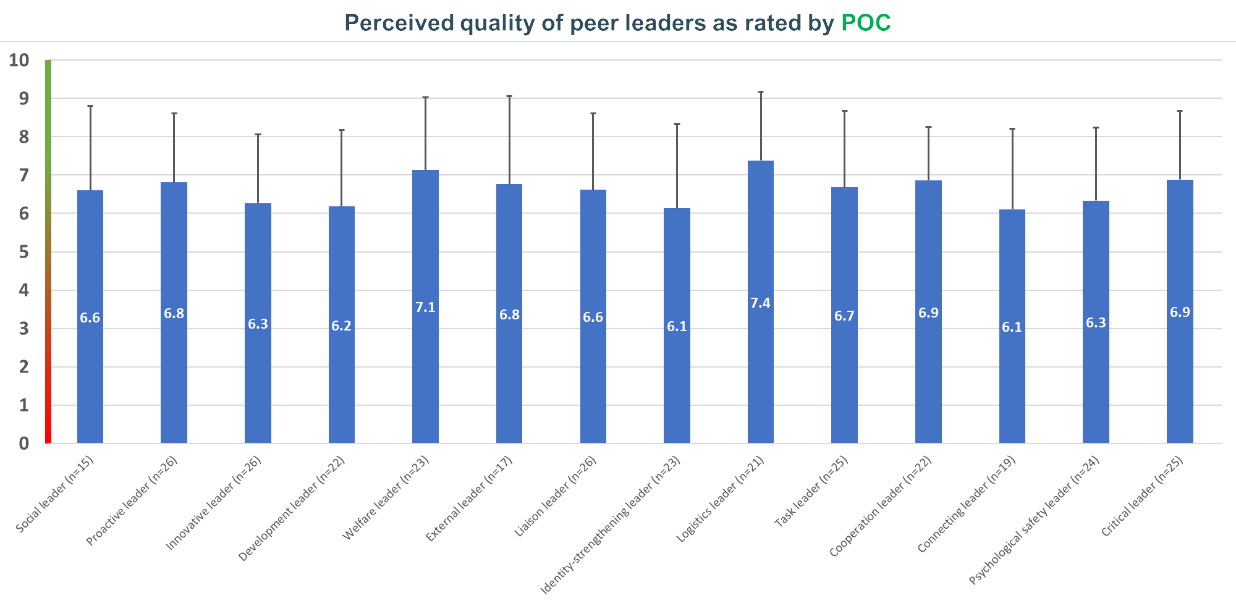
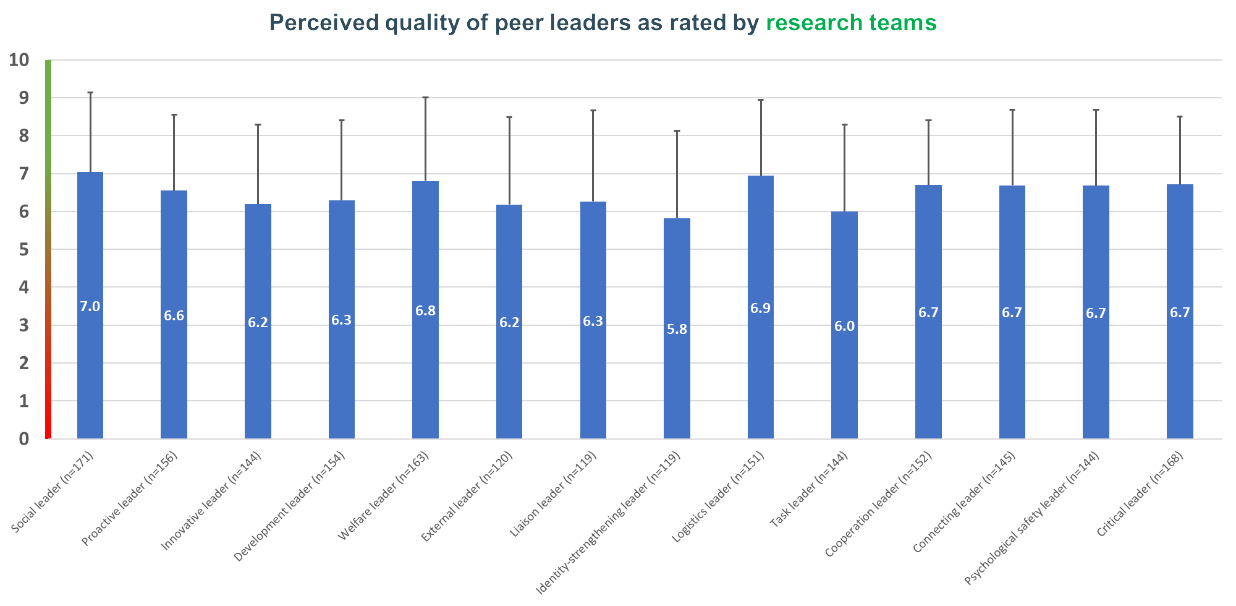
The following graphs depict the average perceived quality of peer leadership roles for faculty/departmental/campus boards, POC-teams, research teams, and ATP-teams. Error bars are incorporated to represent the standard deviations.
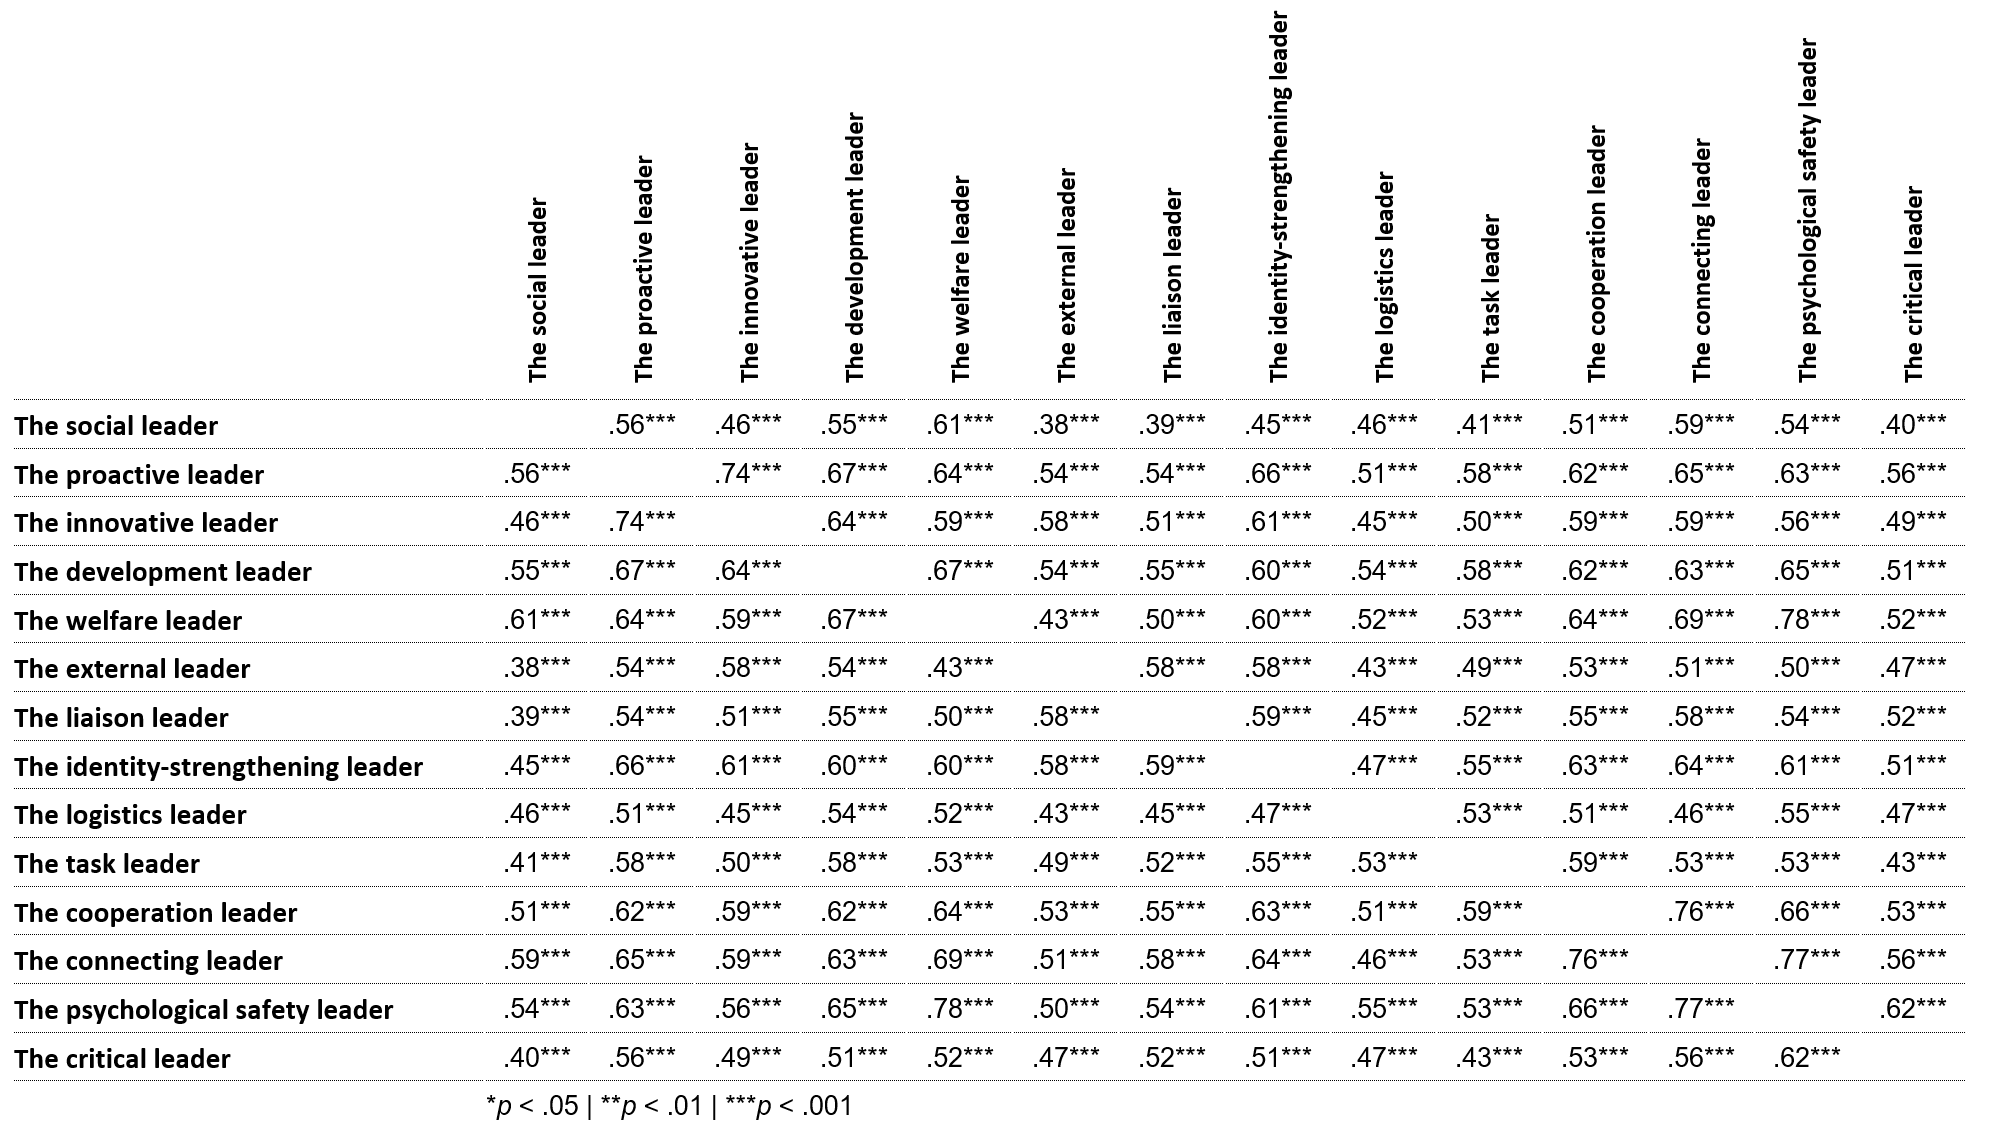
Relation between peer leadership roles
This table represents the correlations between the different peer leadership roles. These findings show a low to moderate interconnectivity between peer leadership roles (with most correlations falling between .40 and .60). With a low to moderate level of interconnectivity being observed between the different peer leadership roles, these findings suggest that, while being related, these leadership roles are different constructs.
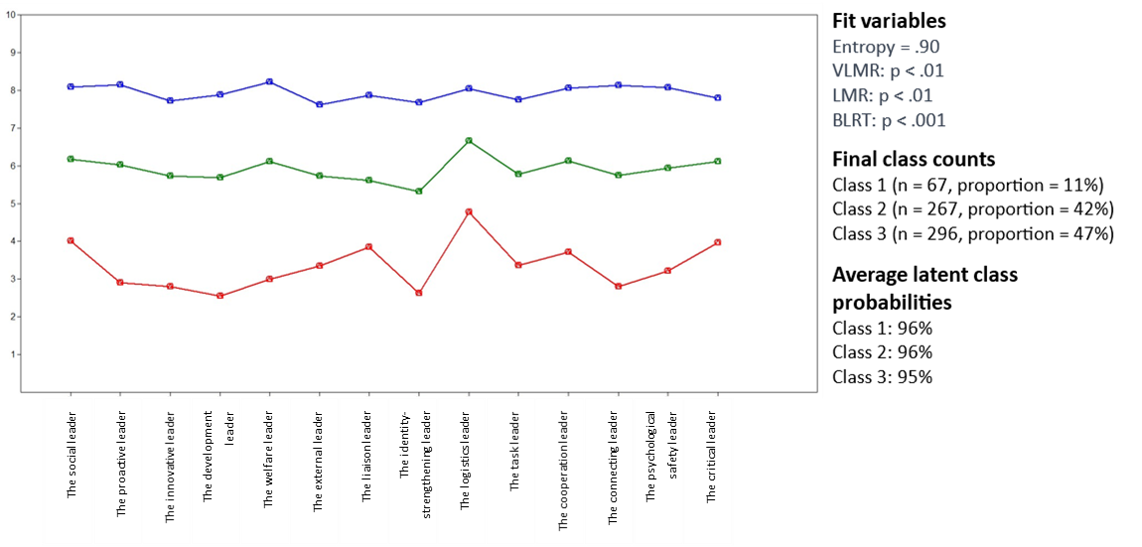
Latent profile analysis
Next, we performed latent profile analyses using M-plus, in order to identify underlying latent profiles or distinct patterns of leadership behaviour. By conducting latent profile analyses, we aimed to identify potential distinct combinations or configurations of leadership roles that tend to co-occur together.
The findings for peer leadership roles mirrored those of formal leadership roles. Similarly, no distinct profiles displaying unique combinations of some peer leadership roles with higher scores and others with lower scores emerged from the data. Also here, the latent profile analyses indicated that peer leadership roles tend to co-occur together. In essence, if the peer leader(s) fulfil some peer leadership roles in a high-quality manner, it is likely that also the other peer leadership roles will be perceived as being fulfilled effectively.