Peer leadership roles related to outcomes
It is important to note that the correlation table only considered data for perceived leadership quality, which was rated on a Likert scale from 0-10. It does not include data from participants who perceived a leadership role as “relevant but not fulfilled”. To address this limitation and gain a more comprehensive understanding of the relationship between leadership roles and team outcomes, we conducted multivariate analyses of variance (MANOVA).
Each leadership role was divided into four categories: one for the data previously not included as (1) relevant but not fulfilled; and three for when the leadership role was fulfilled with (2) low quality (scores 0-4), (3) medium quality (scores 5-7), and (4) high quality (scores 8-10). MANOVA’s were performed for each leadership role, examining its relationship with the six included outcome measures. The chart below presents the overall findings for the different MANOVA analyses.
The visual interpretation of these significant results can be found in the chart below.
Wilk’s Lambda | F | p | ηp2 | |
The social leader | .69 | 12.94 | < .001 | .12 |
The proactive leader | .65 | 15.32 | < .001 | .13 |
The innovative leader | .70 | 12.67 | < .001 | .11 |
The development leader | .69 | 13.14 | < .001 | .12 |
The welfare leader | .65 | 15.86 | < .001 | .14 |
The external leader | .78 | 6.71 | < .001 | .08 |
The liaison leader | .75 | 9.07 | < .001 | .09 |
The identity-strengthening leader | .69 | 12.20 | < .001 | .11 |
The logistics leader | .79 | 7.59 | < .001 | .08 |
The task leader | .73 | 10.46 | < .001 | .10 |
The cooperation leader | .66 | 14.57 | < .001 | .13 |
The connecting leader | .65 | 15.25 | < .001 | .14 |
The psychological safety leader | .67 | 14.07 | < .001 | .12 |
The critical leader | .80 | 7.64 | < .001 | .07 |
η2 = .01; small effect; η2 = .06: medium effect; η2 = .14: large effect | ||||
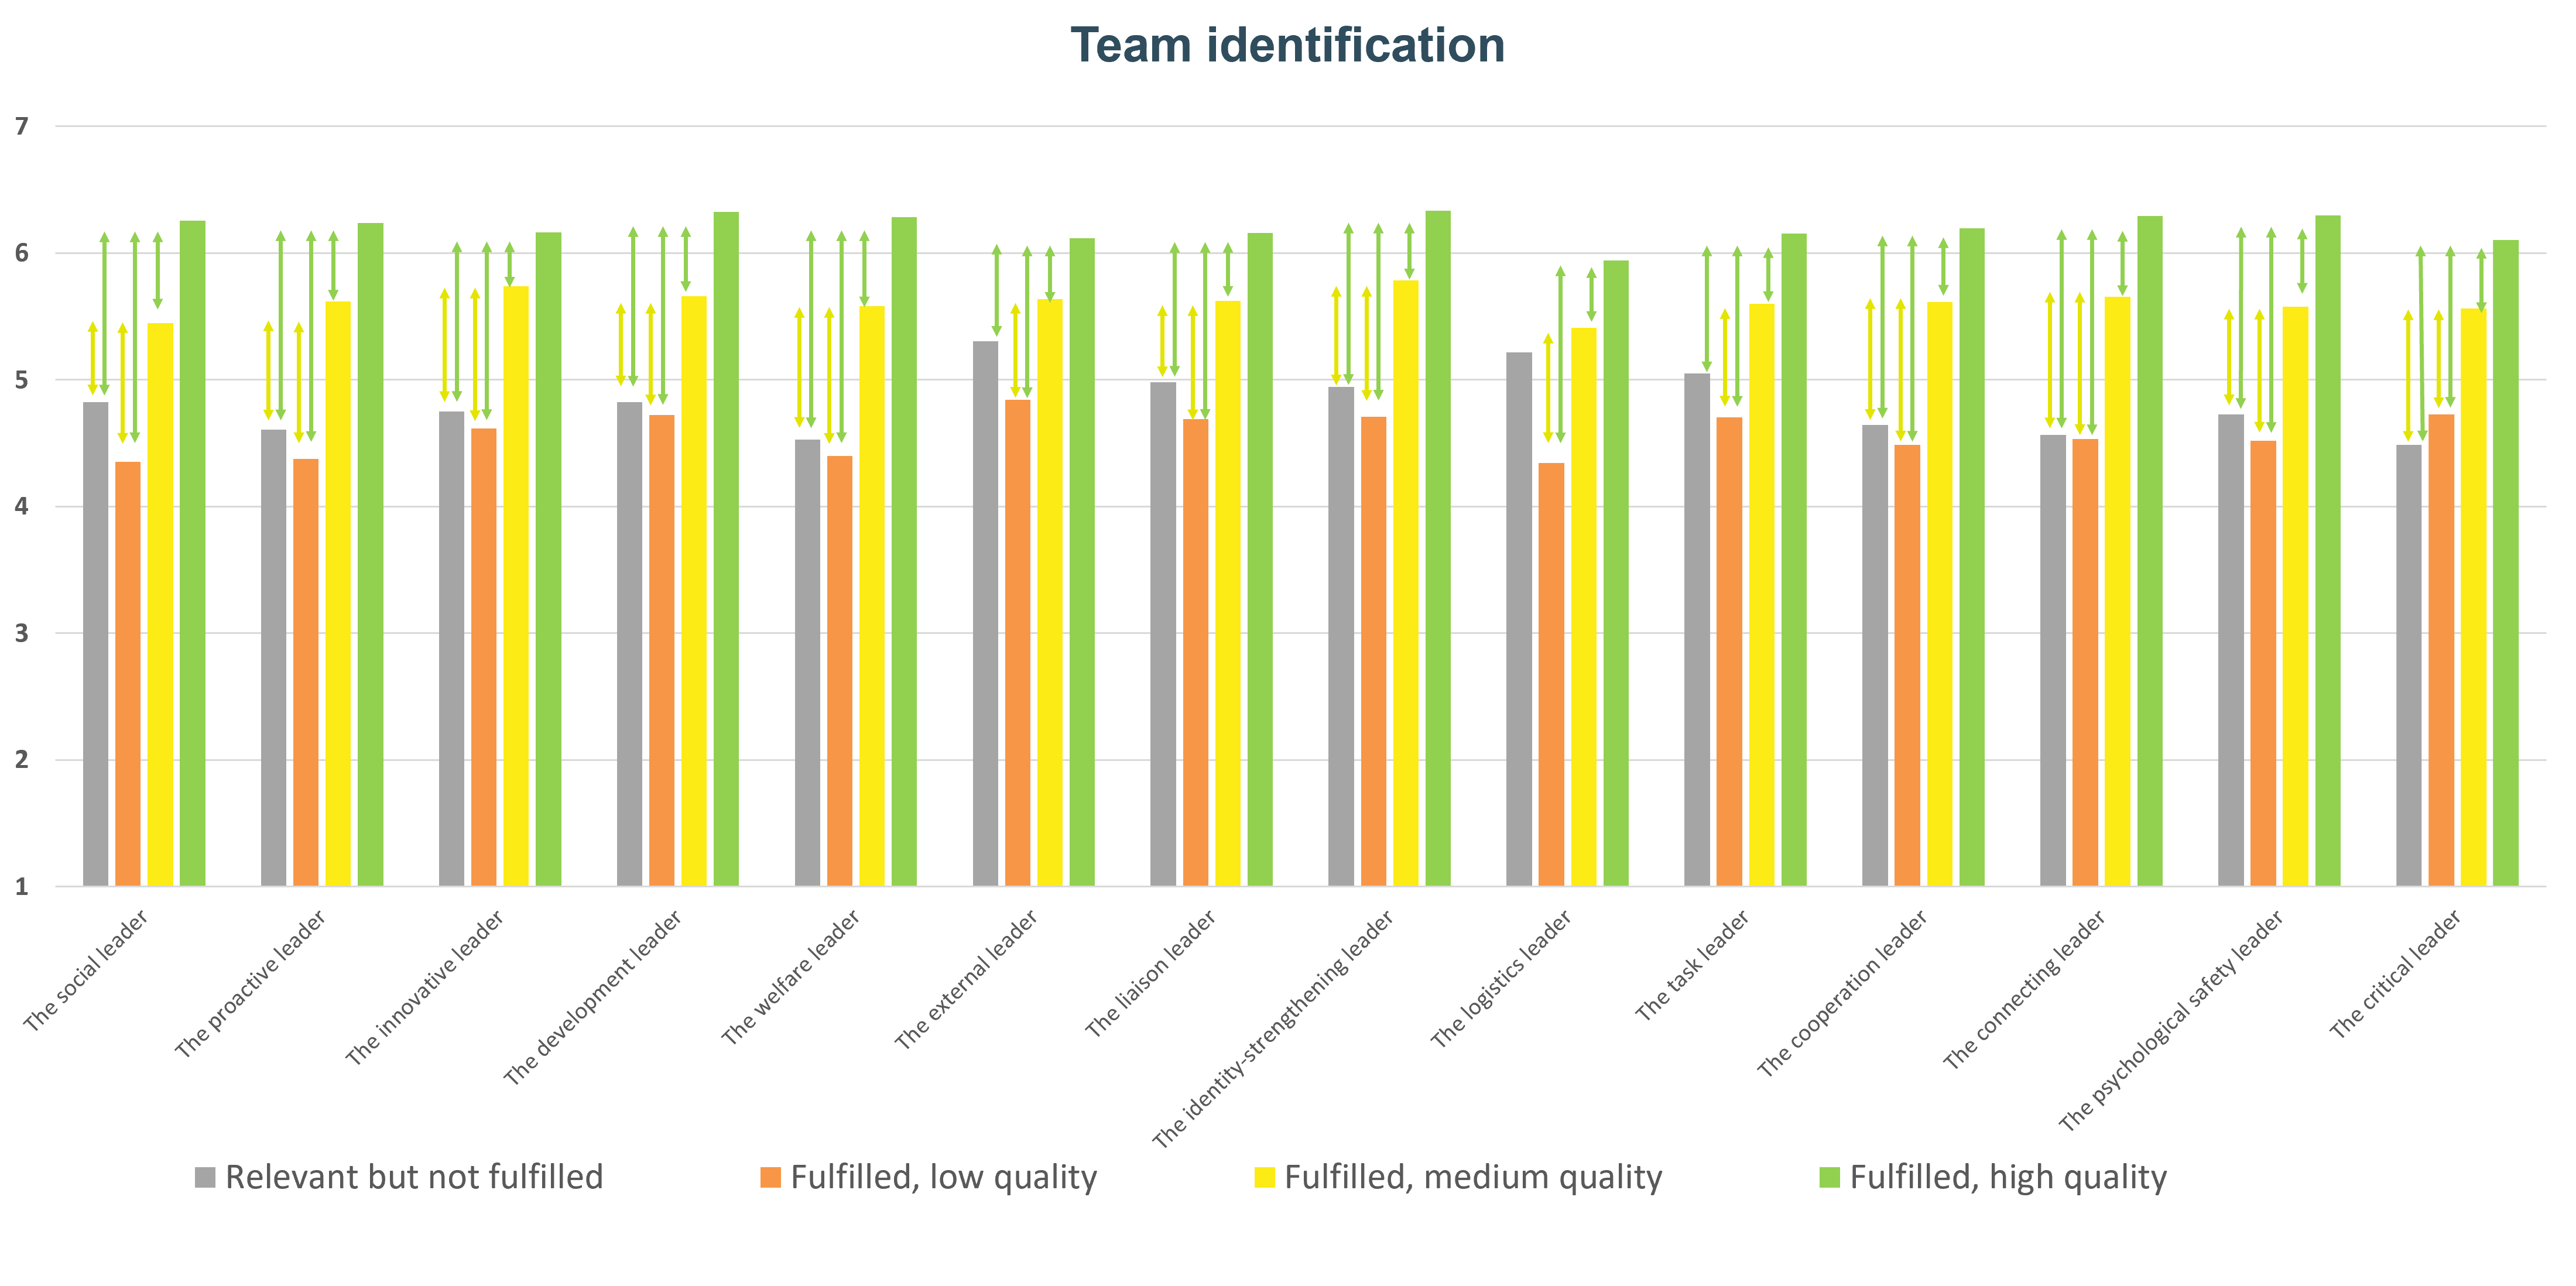
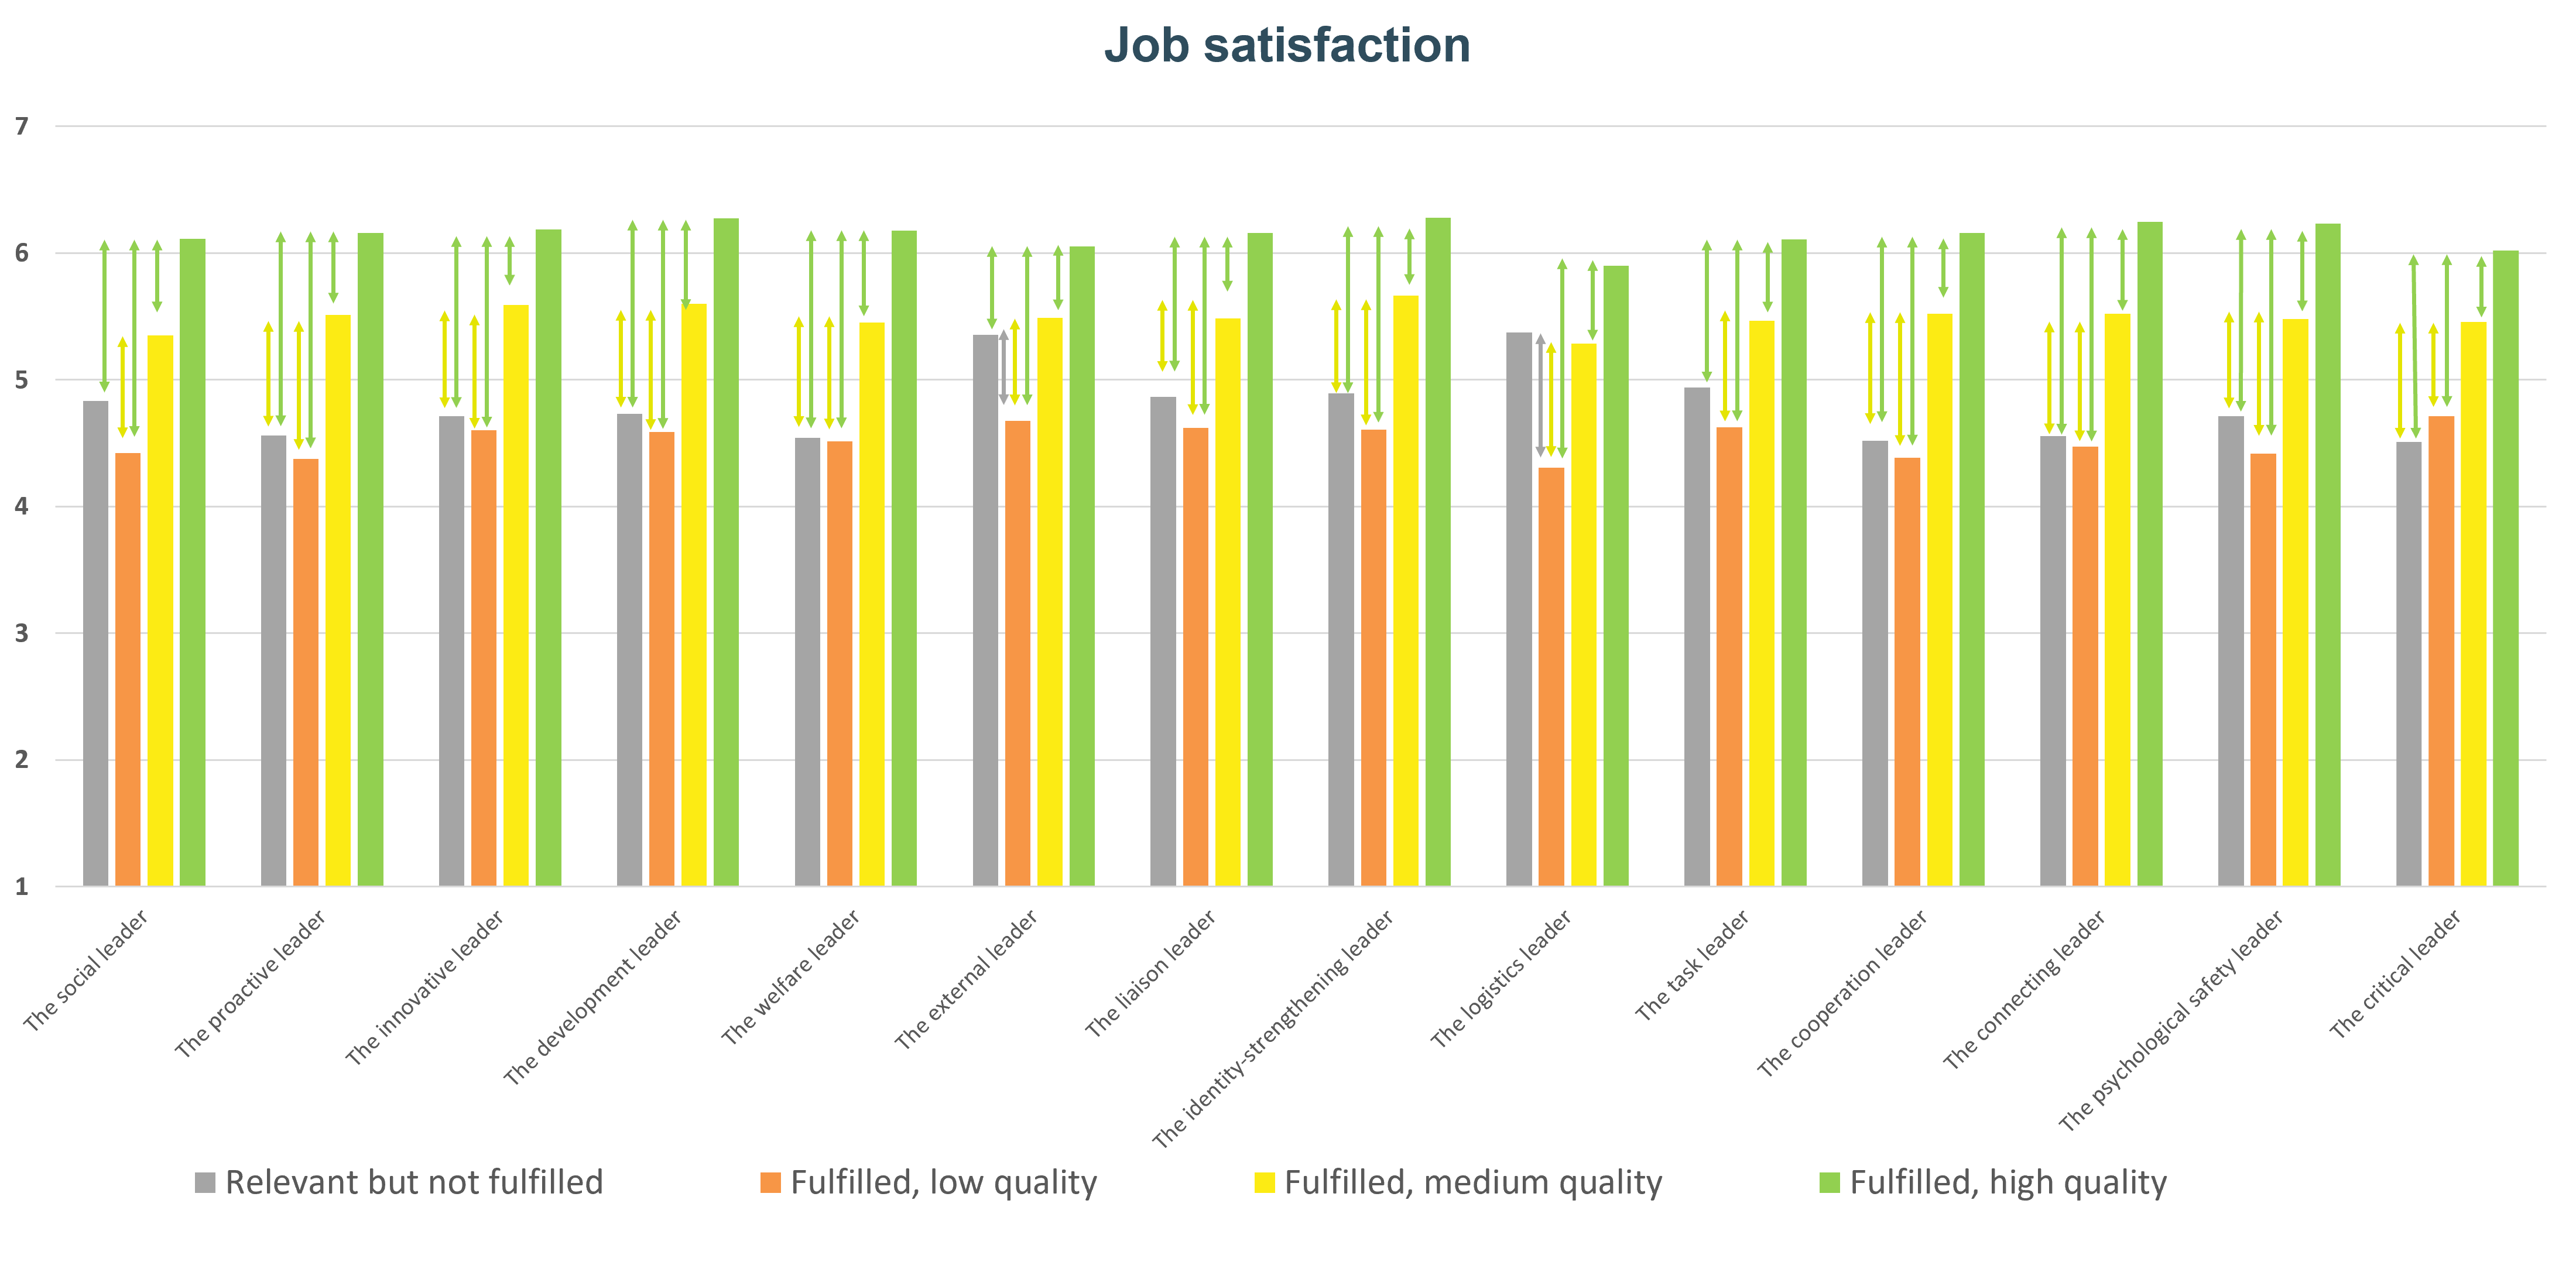
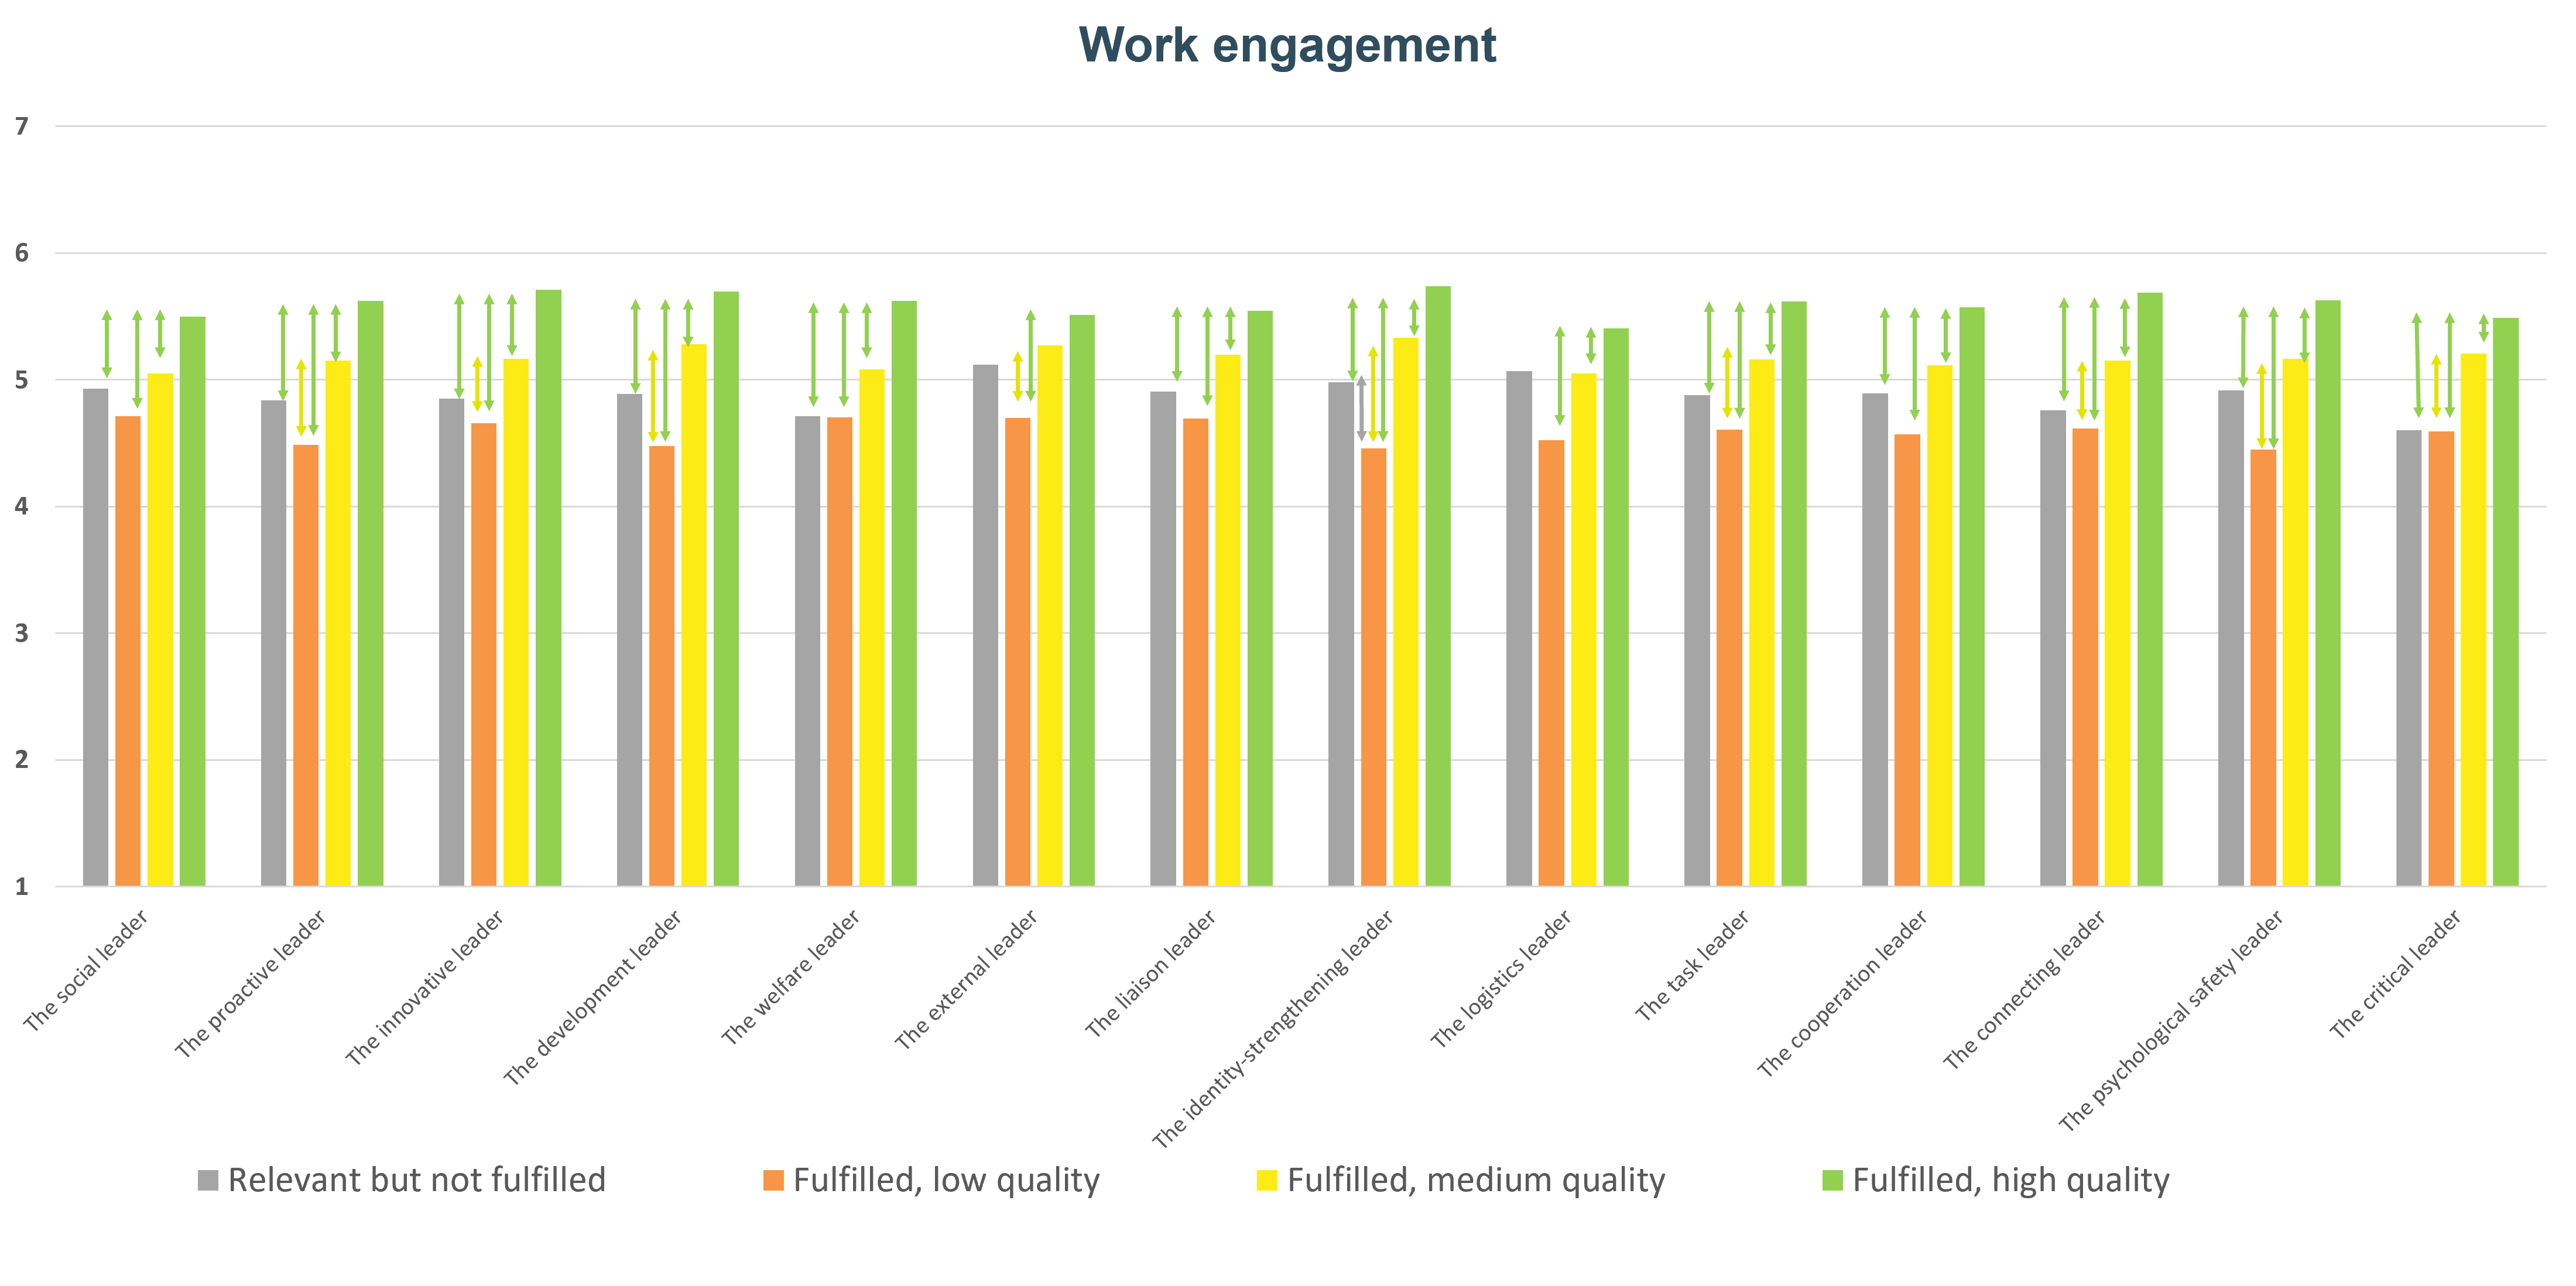
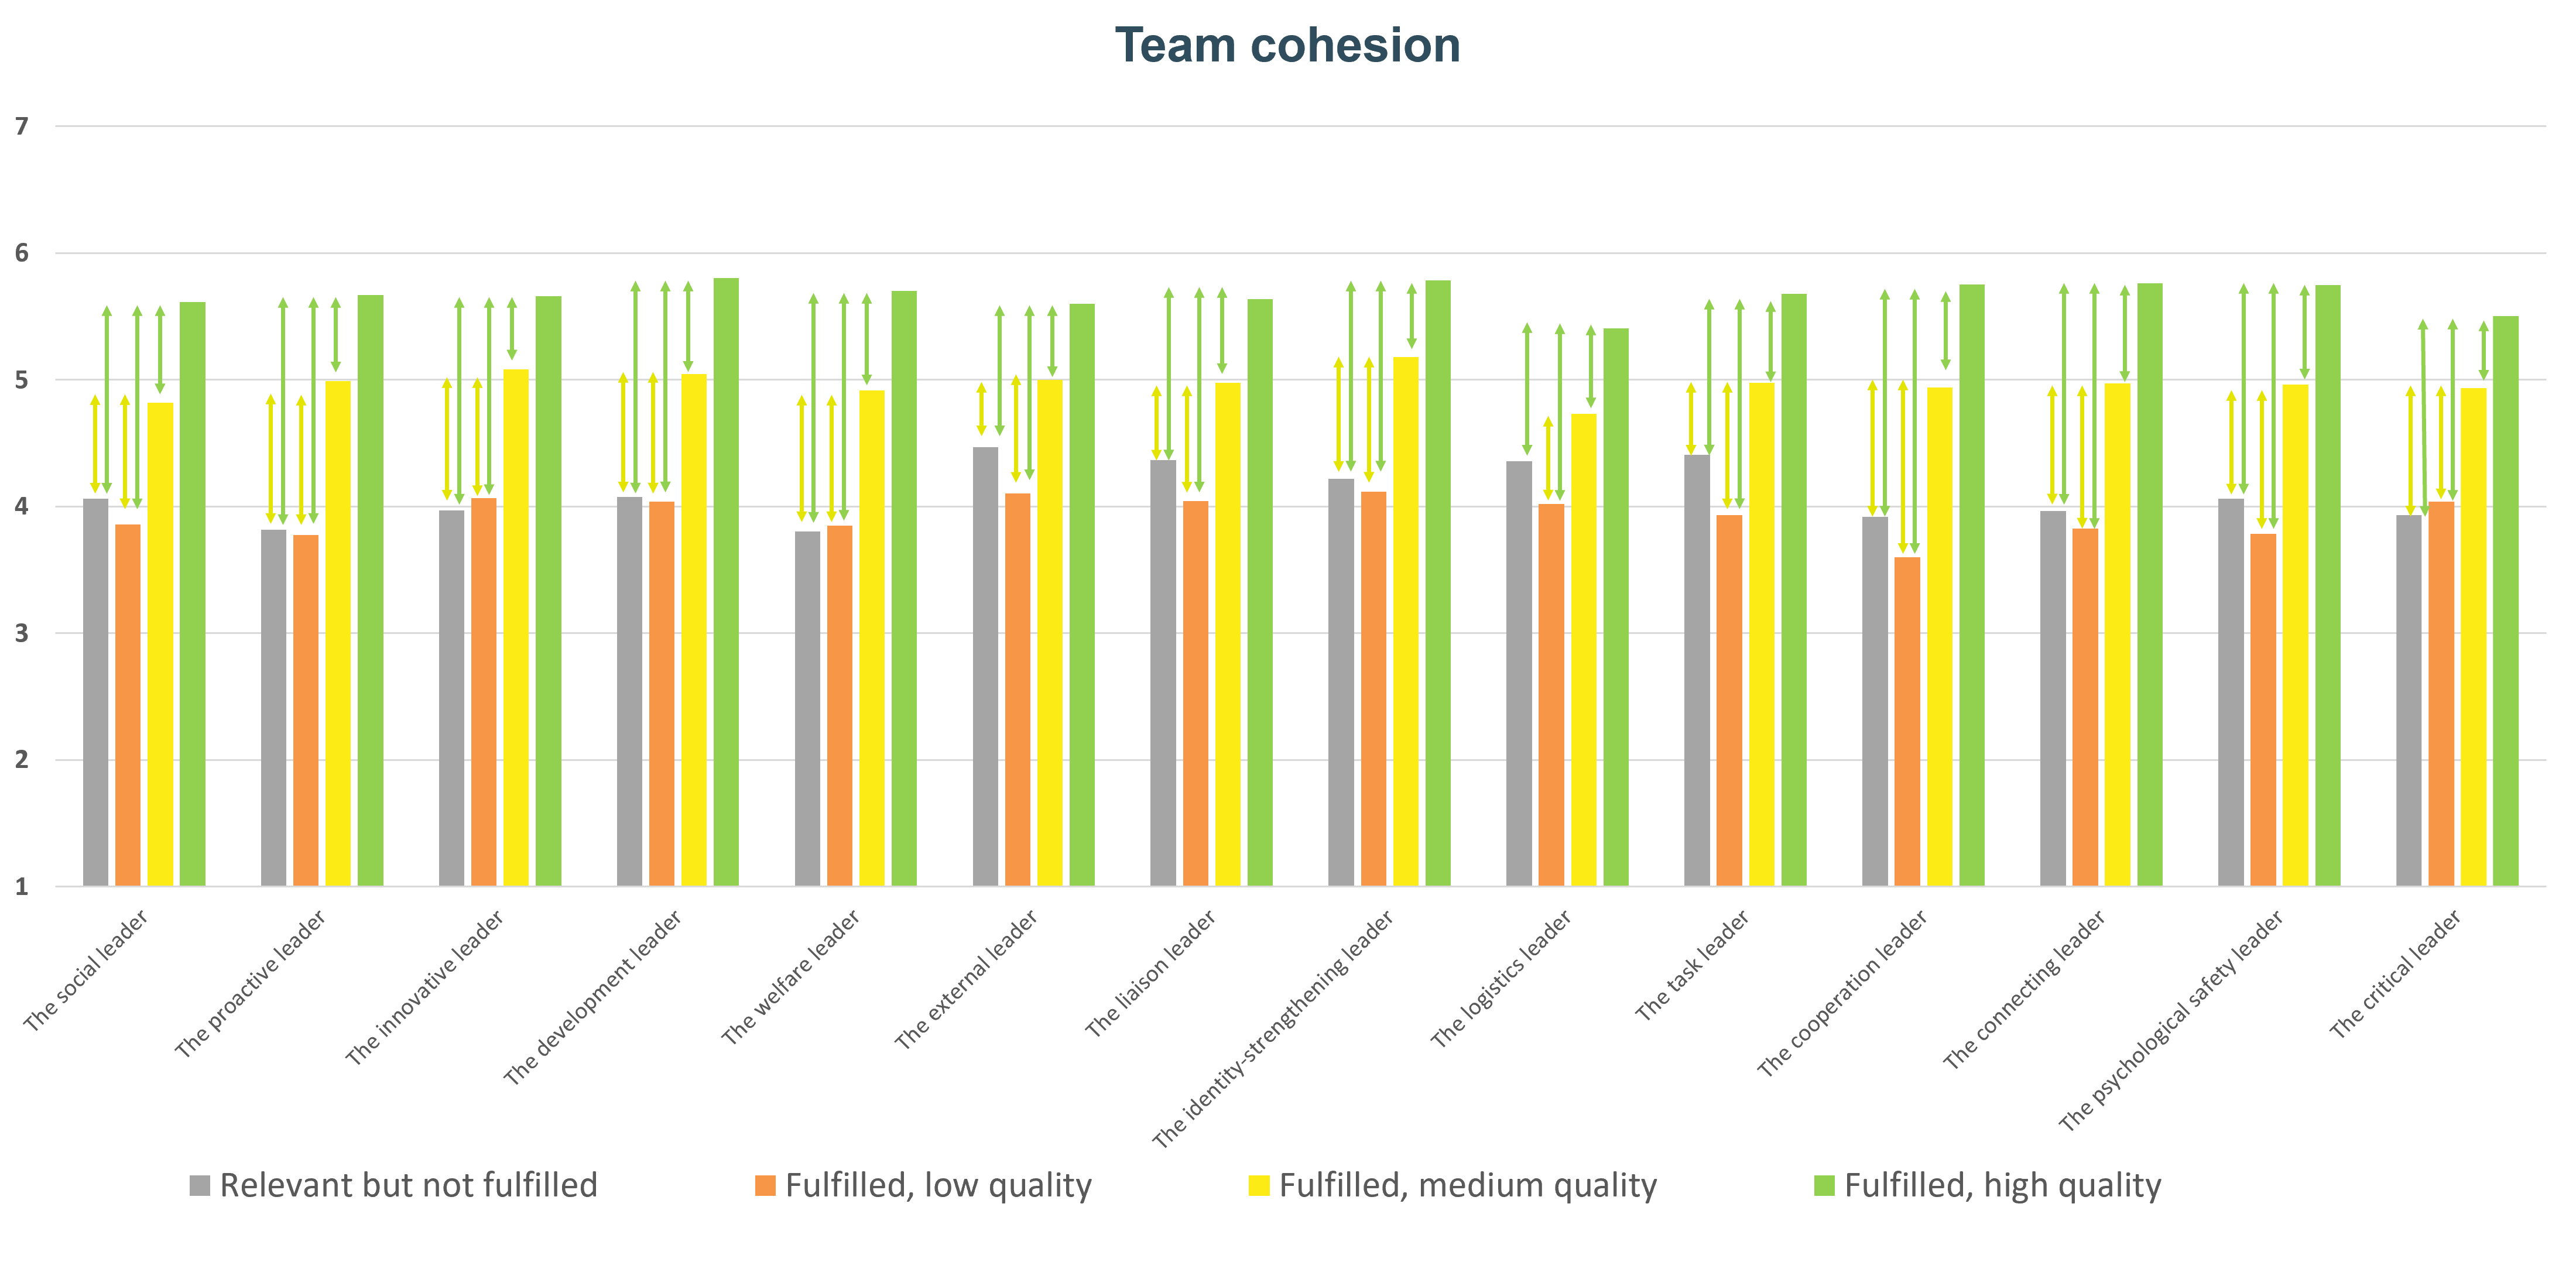
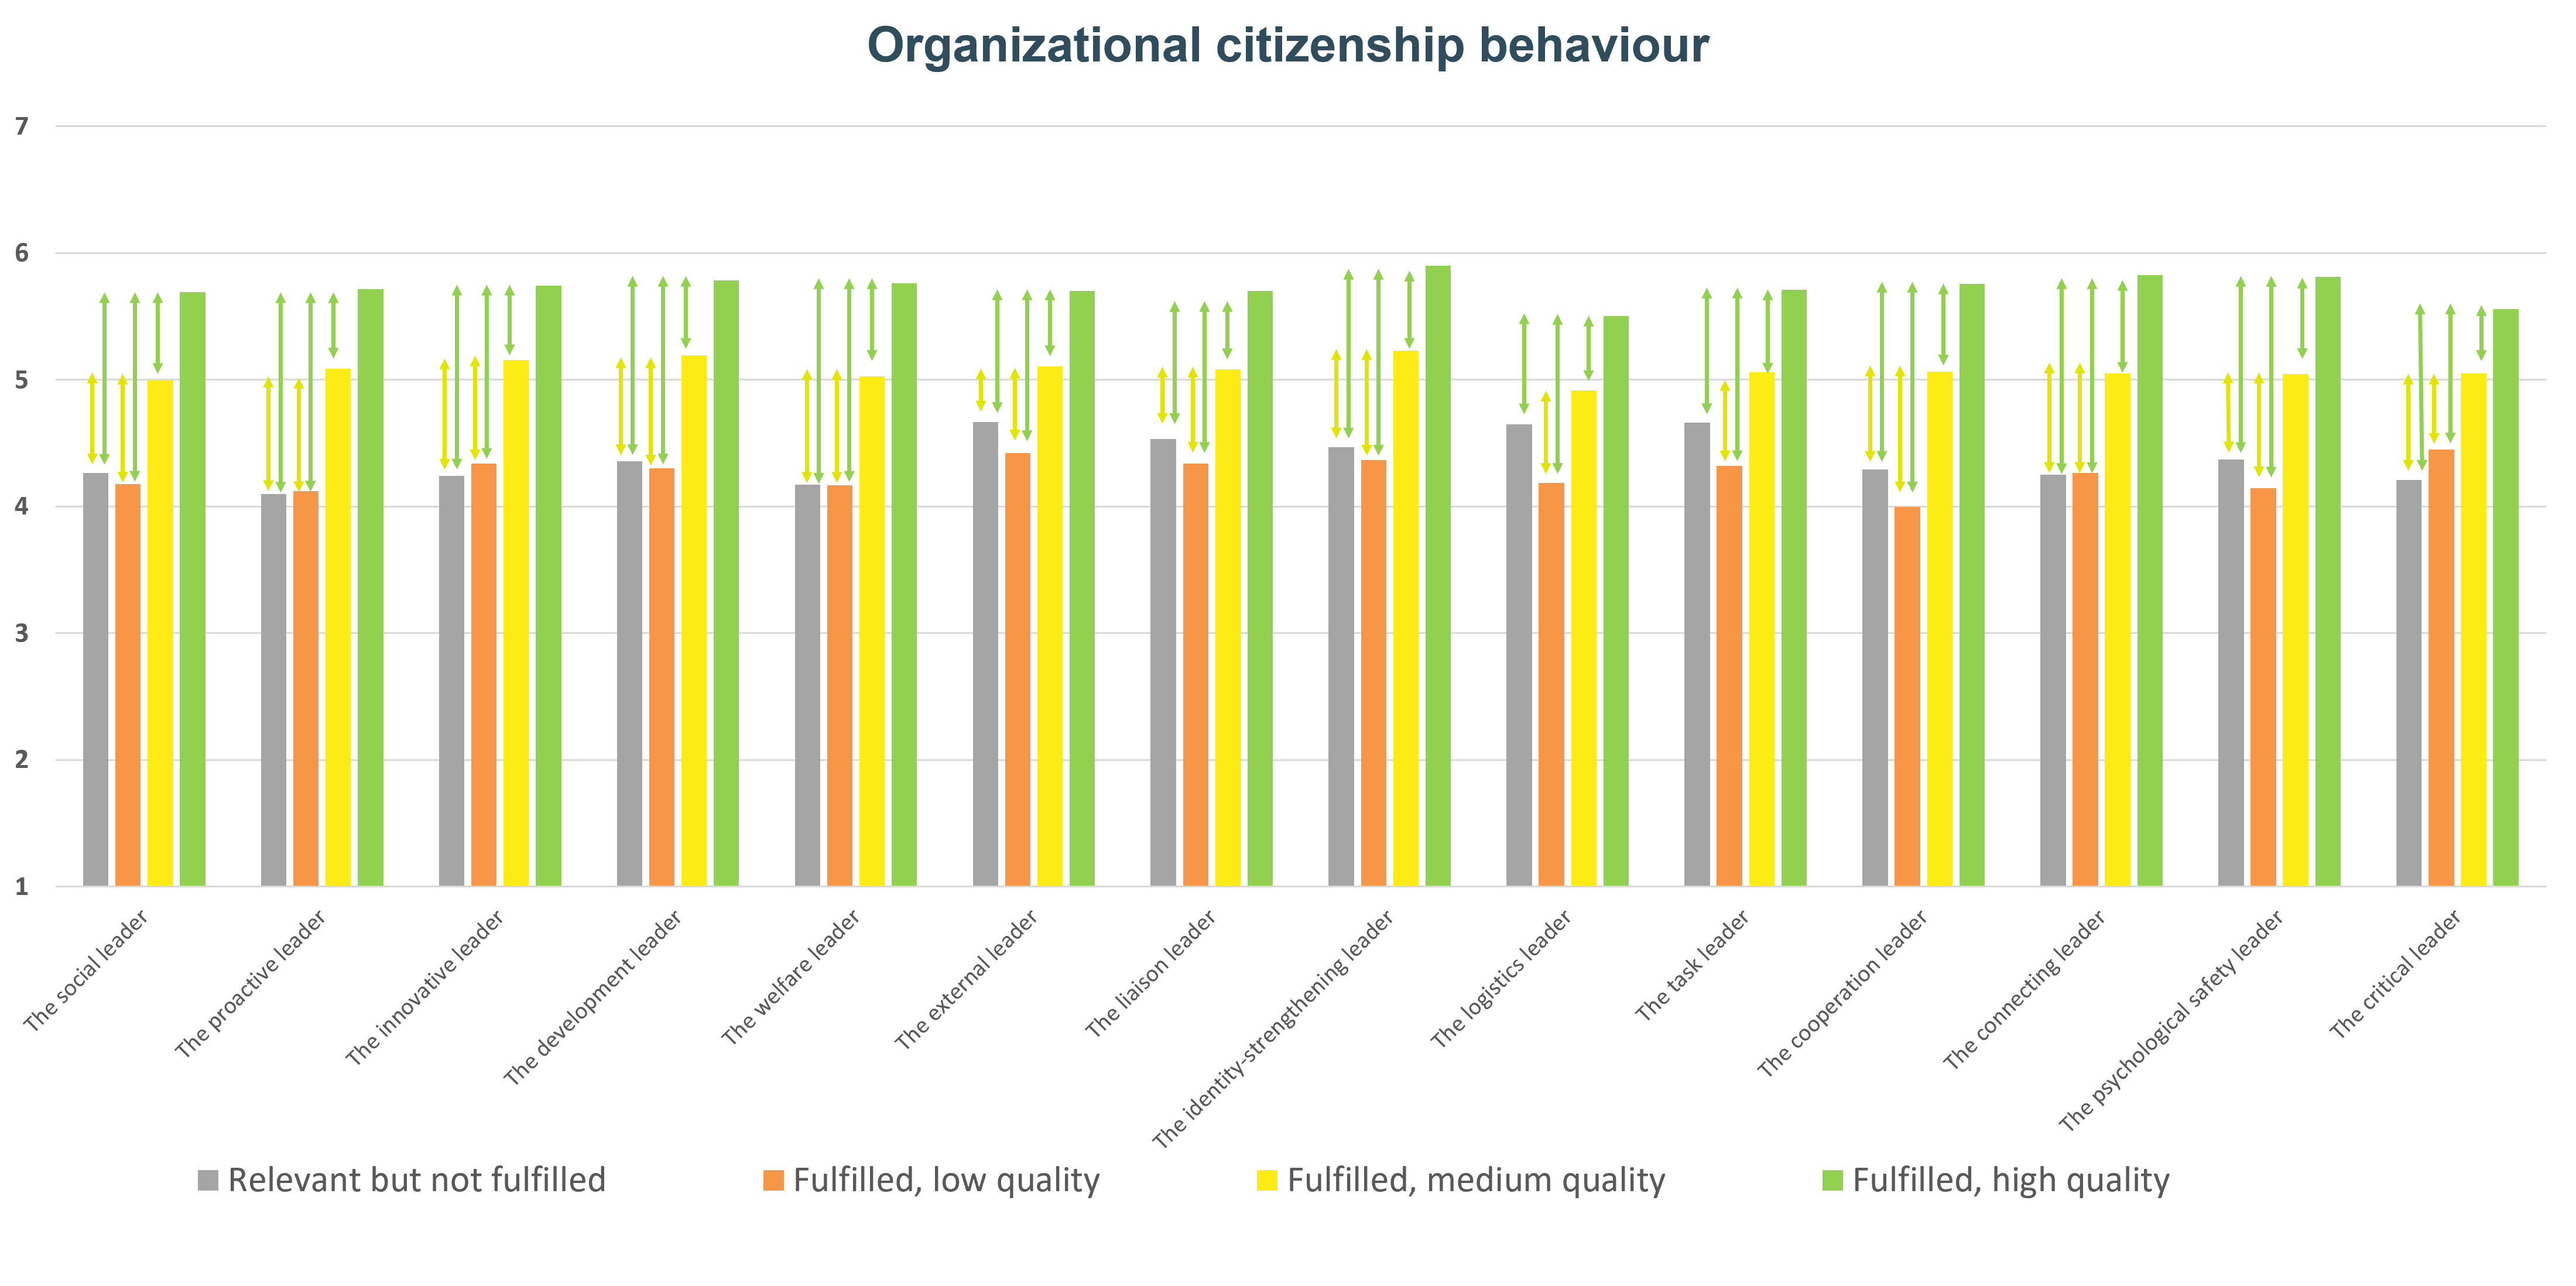
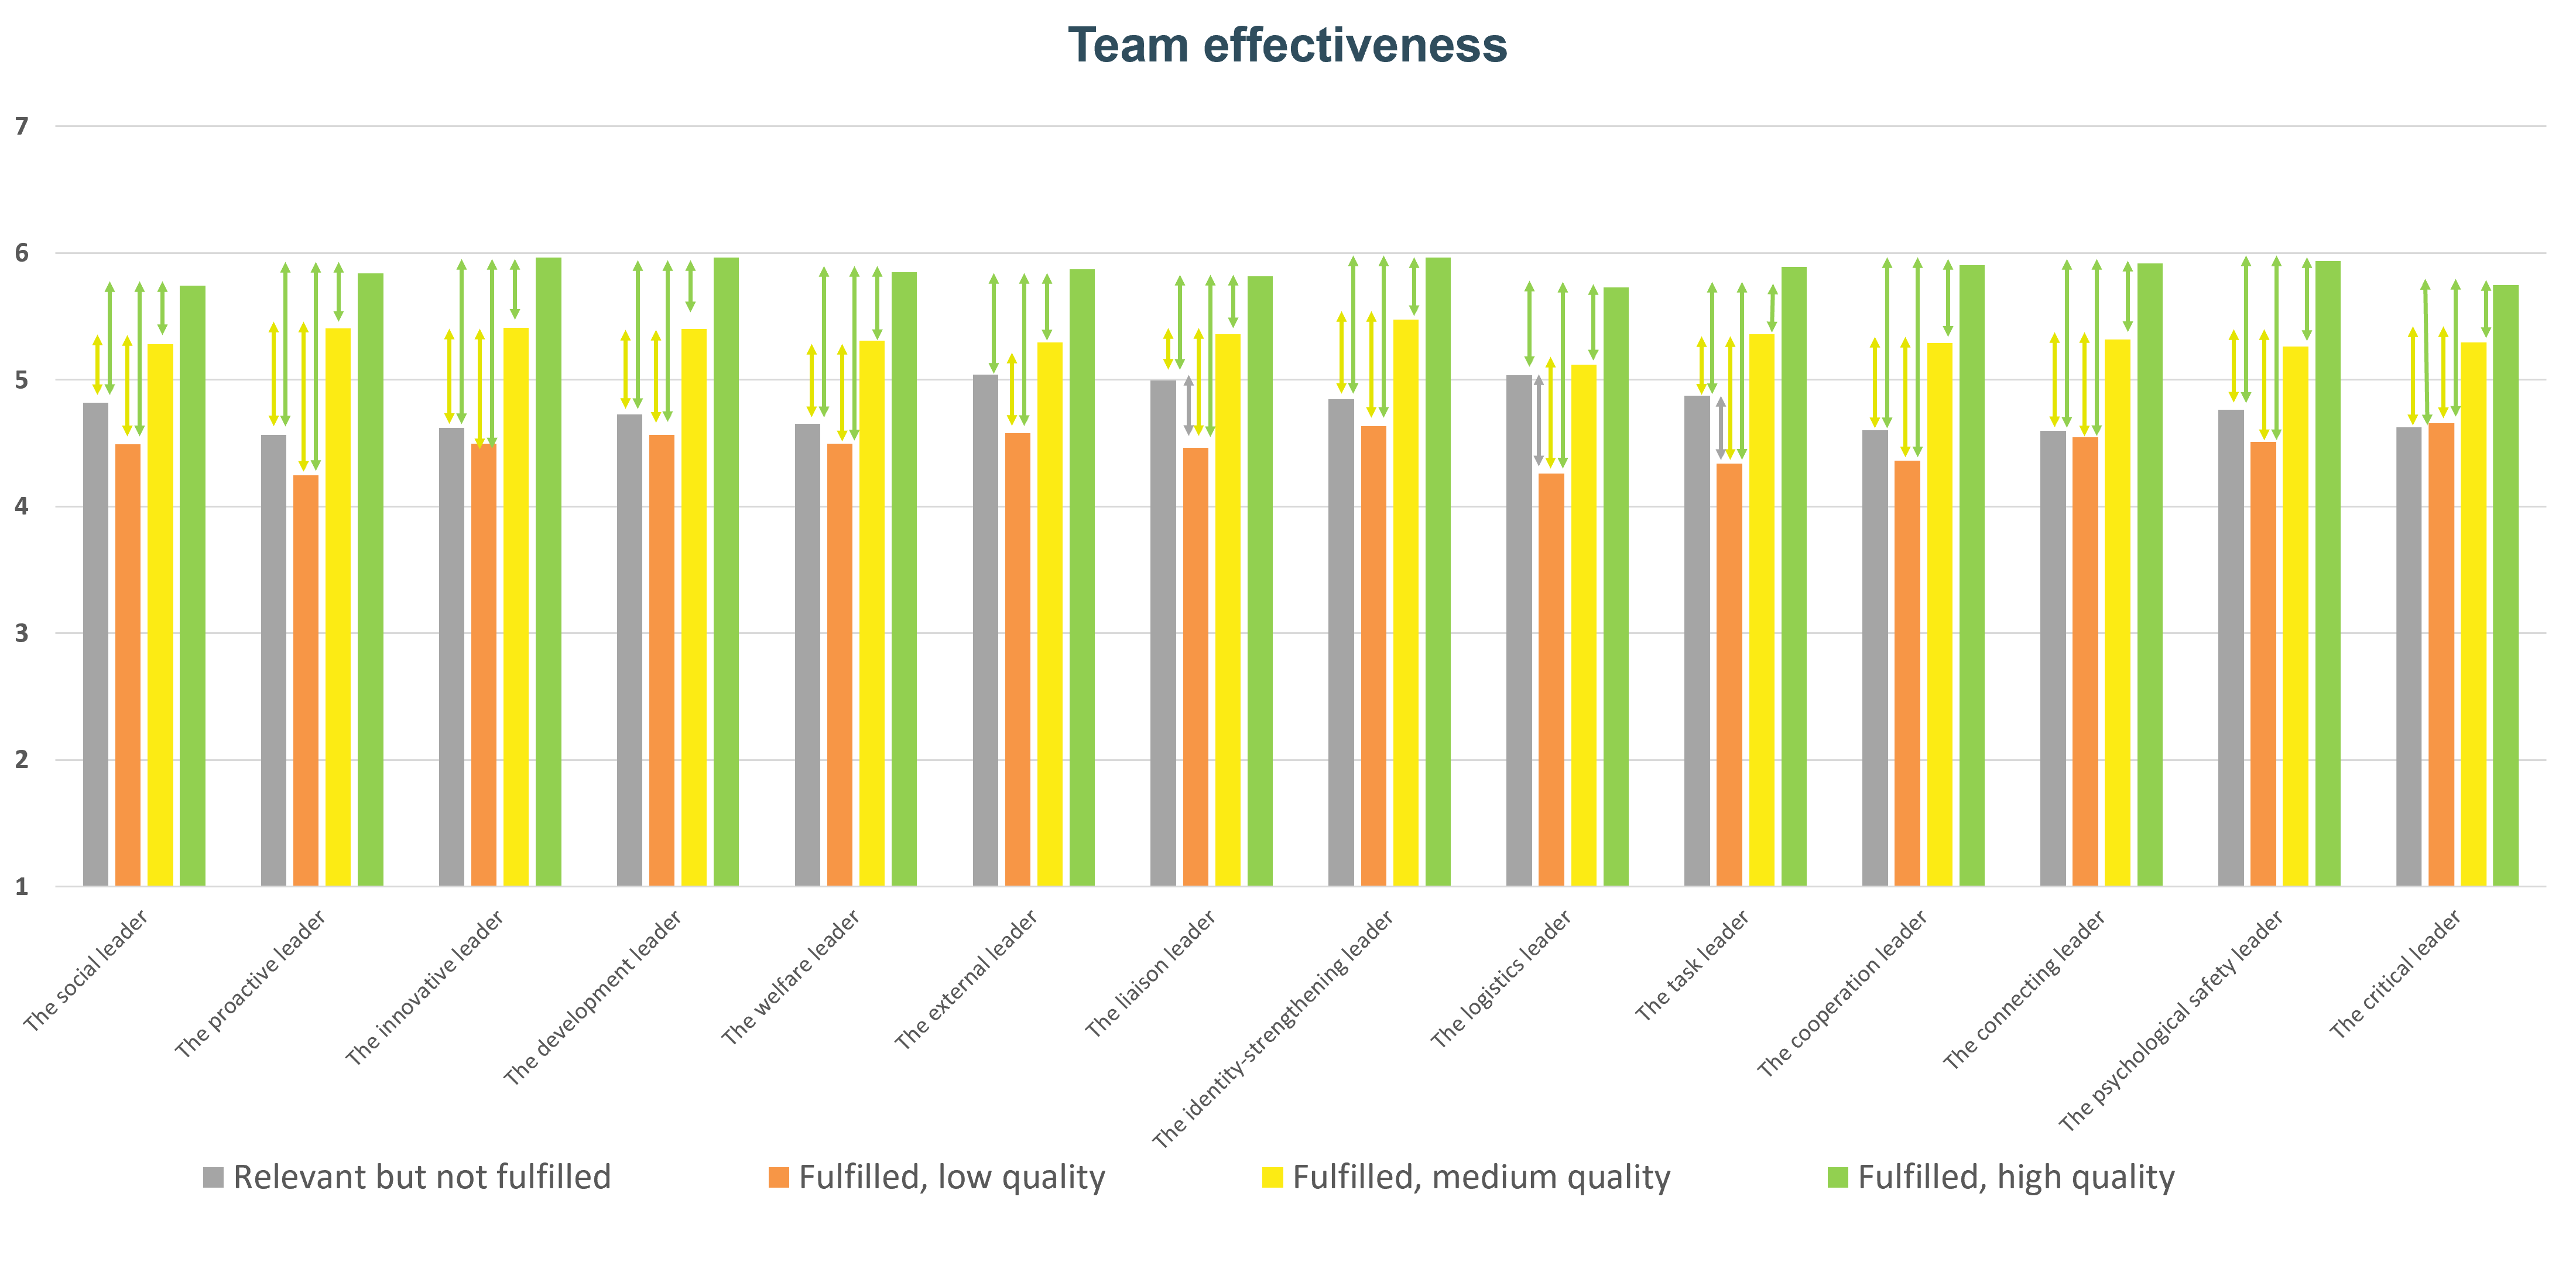
In order to present the data in a more digestible manner, we have visualised the results of the Games-Howell post-hoc tests on a per-outcome basis. So, for each of the six included outcomes, you can see an overview of all peer leadership roles , and how their different categories scored on each outcome. Furthermore, if the Games-Howell test indicated a significant difference between two categories, we added an arrow with the same colour as the category for which that significant difference exists (at a significance level of p < .05). For example, if participants perceived to have a high-quality social peer leader in their team, they would significantly identify stronger with their team, compared to when that social leader was of medium or low quality or not present. In addition, also when participants perceived their social leader to be of medium quality, they would identify significantly stronger with their team compared to when this leader was of low quality or not present. No significant differences appeared between low-quality social leaders and teams in which the social leader was not present.
Necessary Condition Analysis to identify critical peer leadership roles
In order to examine the critical levels of leadership quality necessary for the presence of the included outcomes, we conducted necessary condition analyses (NCA). These analyses aimed to determine if a minimum level of perceived leadership quality is required for certain outcomes, such as team identification. While the full NCA findings are available upon request, we will summarise the overall results here.
Overall, our findings indicate that there is not a reasonable minimum level of perceived leadership quality that is necessary for a specific peer leadership role to achieve high levels of team identification, job satisfaction, work engagement, team cohesion, organizational citizenship behaviour, or team effectiveness. While our previous findings strongly indicate that having high-quality peer leaders is associated with better scores on these outcomes, it appears that high-quality leadership on one particular leadership role is not a necessary condition to achieve high levels of our measured outcomes.
Here you find an example graph for the relationship between the perceived quality of cooperating leadership and team identification. The horizontal axis represents the perceived quality of cooperating leadership, while the vertical axis represents team identification. The graph displays three different sources of information: the Ordinary Least Squares (OLS), the Ceiling Envelopment - Free Disposal Hull (CE-FDH), and the Ceiling Regression - Free Disposal Hull (CR-FDH).
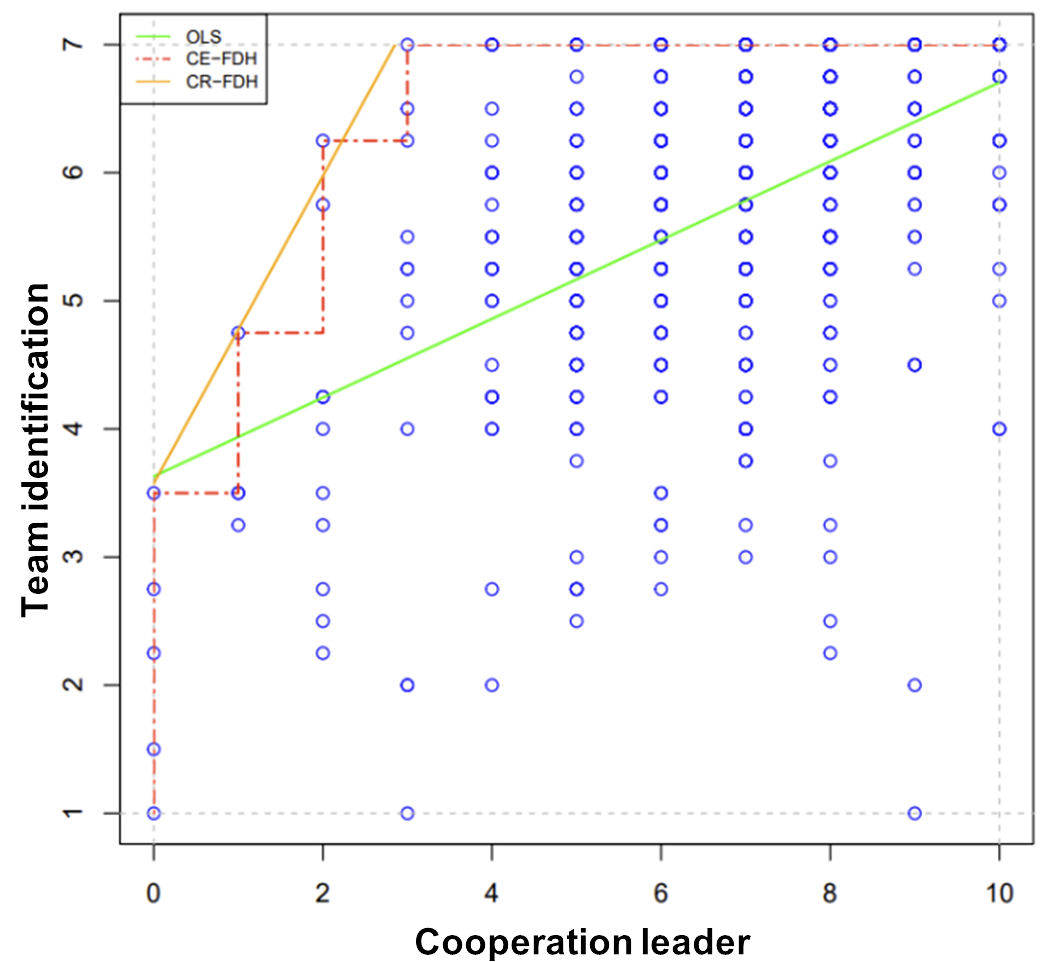
The OLS line represents a linear regression that estimates the overall relationship between perceived leadership quality for this specific leadership role and team identification. It provides an average estimate of how team identification changes as the perceived quality of leadership changes. However, in the context of necessary condition analysis, this line is not the main focus.
The CE-FDH line represents the upper limit or ceiling of team identification that can be achieved at specific levels of perceived leadership quality for the given leadership role. The CR-FDH technique is a ceiling approximation that smooths the step function obtained by the CE-FDH technique by using OLS regression through the upper-left corners of the step function.
In sum, while the OLS line confirms the positive relationship between the perceived quality of the cooperation leader role and team identification, both CE-FDH and CR-FDH confirm that it is possible to reach very high (or even maximal) levels of team identification with fairly low perceived quality of cooperation leadership (i.e., a minimum score of 3 on the cooperation leader's quality is needed to achieve maximum team identification).
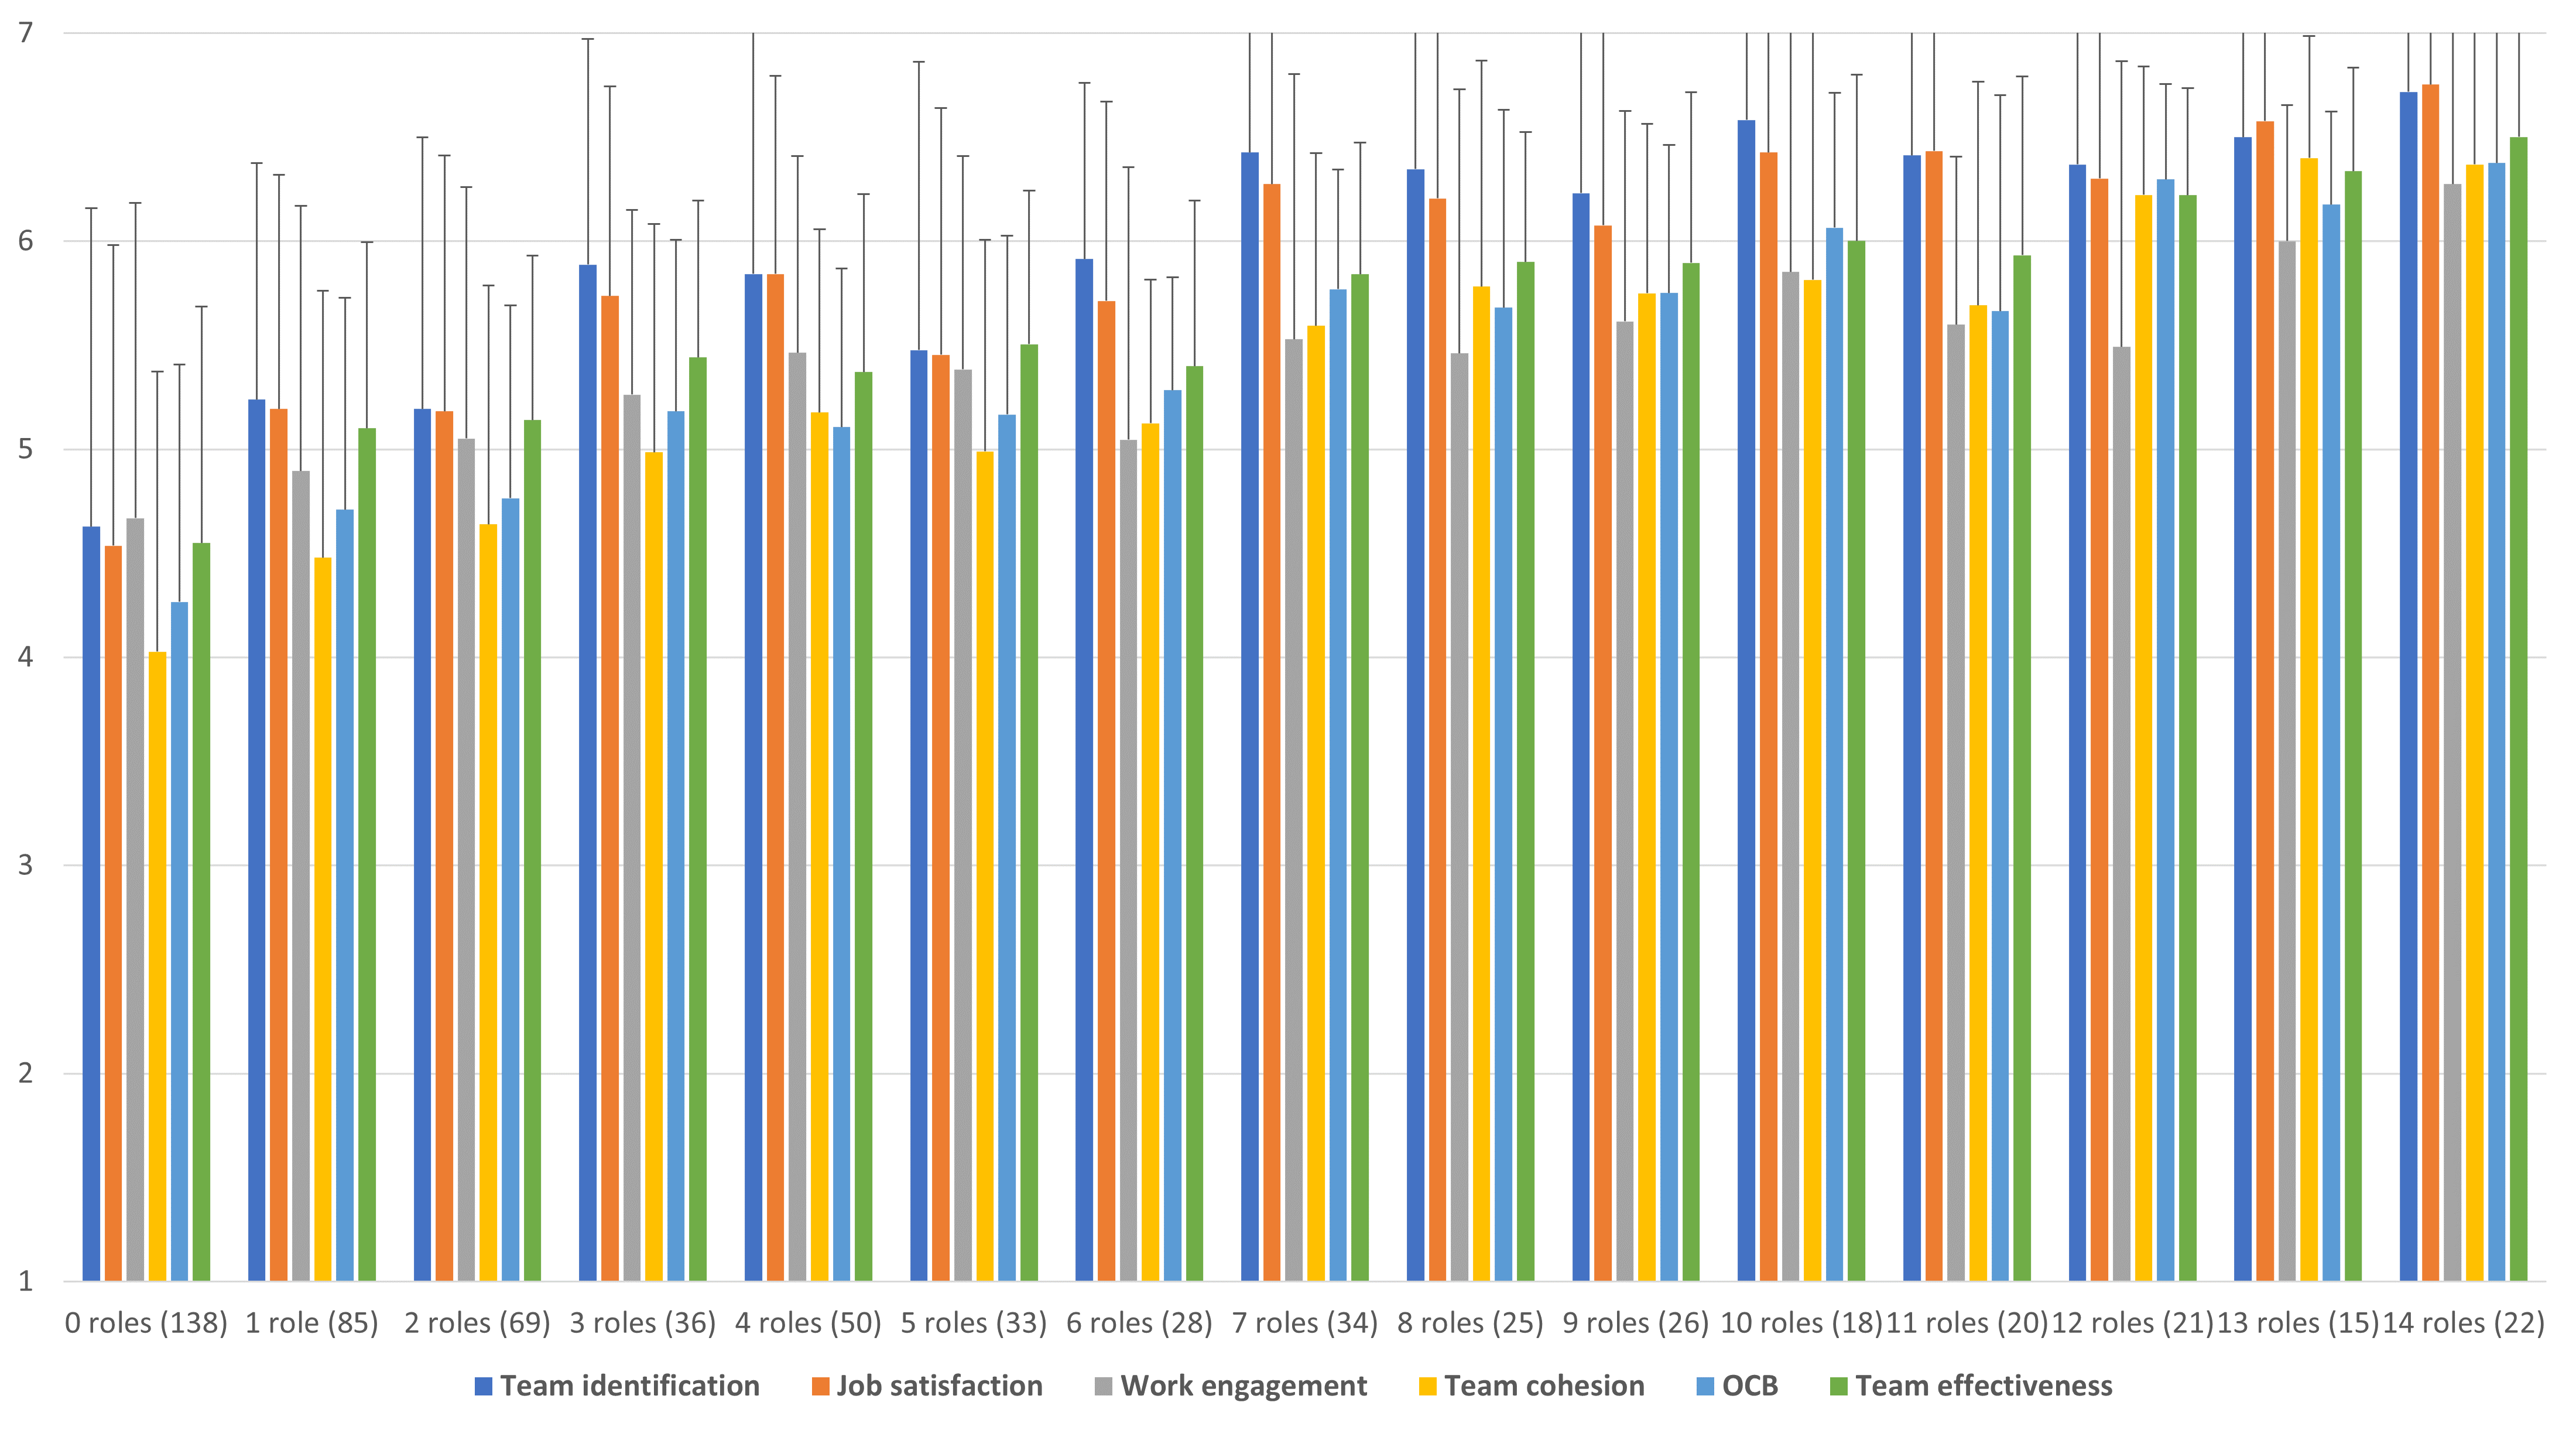
How many peer leadership roles are needed?
One limitation of the NCA results is that they focus on individual leadership roles, considering only one role at a time. To overcome this limitation, we sought to investigate the relationship between the number of peer leadership roles perceived as "high quality" (rated higher than 7 on a scale from 0 to 10) and the included outcomes. The bar chart presented below illustrates the average scores for the six included outcomes, categorised based on the number of peer leadership roles that participants rated higher than 7. The error bars represent the standard deviations for each average.